
The $1 Trillion Memory Singularity
The complete memory primer: DRAM, NAND, HBM, the supercycle, the LTA revolution and the seven debates that decide whether to own it

Welcome to the most comprehensive analysis of the memory sector.
This is Part 1 of the Memory Singularity series (Part 1 is free, Parts 2 and 3 will be paywalled). Part 1 establishes the foundation: what DRAM, NAND and HBM are, who makes memory and who now consumes it, how we are entering a $1tn singularity and the debates that decide whether you should own memory. Part 2 delivers the Winners and Losers playbook, ranking every expression of the theme across makers, equipment, test and storage, with paid subscribers voting on which name gets the next dedicated deep dive. Part 3 is the China piece: CXMT, YMTC, the equipment localisation race and the sponsor game theory that could reshape the industry.
Twice a week, I will release deep dives into stocks and sectors that fit into the 6 themes that I see winning in the coming years and decades: AI & Technology, Electrification & Energy, Reshoring & Sovereignty, Healthcare & Longevity, China & Asia, Resilience & Quality.
Take advantage of this once in a generation opportunity to build long term wealth by investing in great stocks that will deliver returns for your portfolio for years to come.
Memory Primer: The $1 Trillion Memory Singularity
After reading this article, you will understand exactly what DRAM, NAND and HBM are and why physics forces the trade-offs between them, who makes memory and who now consumes it, why the most brutal commodity in semiconductors has re-rated from $420bn to $3.9tn of market cap in eighteen months, how the new long-term contracts actually work clause by clause, where supply can and cannot respond before 2028, and, most importantly, how to think about the bull and bear cases that decide whether this is a generational regime change or the most seductive peak-cycle trap the sector has ever set.
I highly recommend reading/listening to the most comprehensive guide on semiconductors, which I put out in Aug 2025 and semiconductor equipment in Feb 2026, to understand everything about the most important sector in the world and why it remains one of the best places to invest in the market.


This piece sits on top of the structural work already published on Crack The Market on the semiconductor value chain:
The Semicap Supercycle
The US Memory Makers: SanDisk & Micron
The European Semicaps: Besi, ASM International, ASML and Technoprobe
The Analog & Power Semis: Infineon & STMicroelectronics
The Photonics Supercycle
The AI Accelerators: Nvidia & Broadcom
CPUs are the next GPUs
The Foundries: TSMC
The EDA & IP names: Cadence & ARM


Table of content:
Memory 101: the hierarchy, the cell physics of DRAM and NAND, and the anatomy of HBM
The industry map: who makes what, who consumes what, and the regime change in the customer base
The supercycle: the demand vectors, the supply constraint, and every capacity announcement that matters
The LTA revolution: the seven dials of the new contracts and the three structures on the table
Storage: NAND, the enterprise SSD wave, and the hard drive question
The value chain: the three ways to own the theme, from makers to arms dealers to adjacencies
The great debates: seven bull/bear arguments, my view on each, and whether to own memory right now
1. Memory 101: the technology map
Everything a computer does is a conversation between logic and memory. Logic computes, memory holds the data being computed and the results.
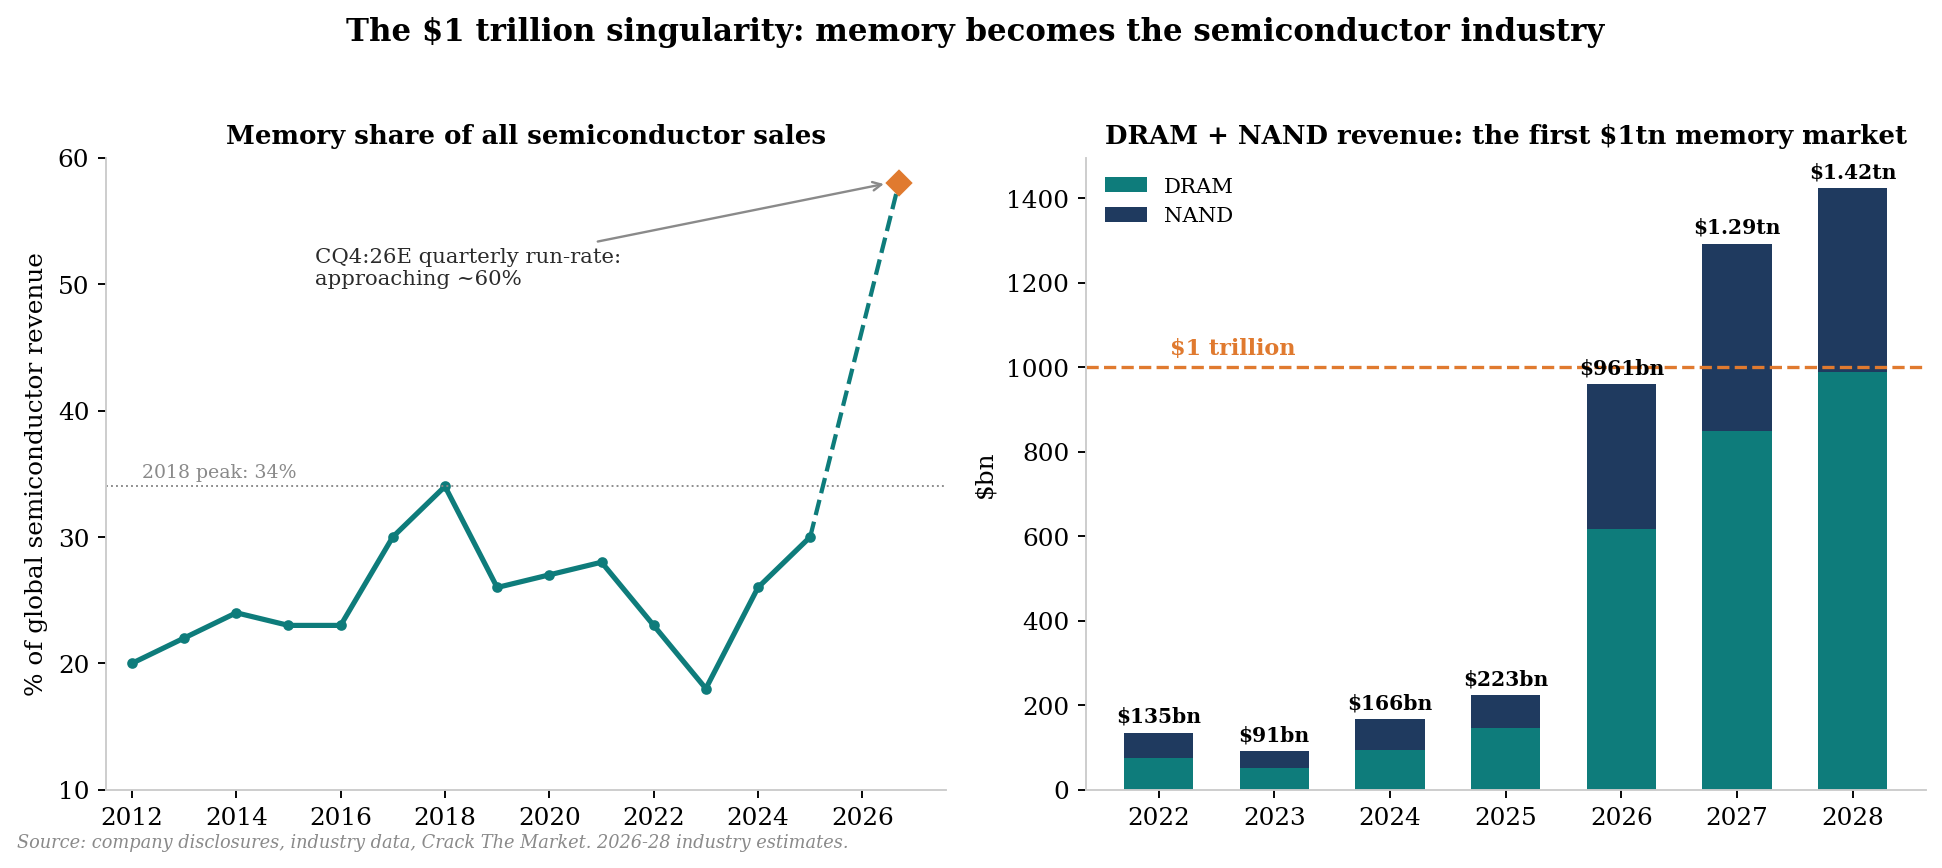
The semiconductor industry splits roughly into logic (historically about 42% of revenue), memory (about a quarter/third historically, and rising fast in the AI era to now approaching 60%), and analog and discrete (the rest).
This section is the foundation for everything that follows: the physics is the economics, and the economics is the investment case.
The hierarchy: fast, cheap, persistent. You can only pick two.
The single most useful mental model in the entire sector is this: you cannot build a memory that is simultaneously fast, cheap and persistent.
Physics forces a trade-off, and every memory product that exists is a different answer to it. That is why computers use a hierarchy, a pyramid of tiers, each slower and cheaper than the one above it:
SRAM sits inside the processor itself as cache. Nanosecond access, but it takes six transistors to hold one bit, so it is extravagantly expensive and tiny. You do not invest in SRAM, it is part of the logic chip.
DRAM is the working memory, the desk the processor works at. Tens of nanoseconds, one transistor and one capacitor per bit, but volatile: cut the power and everything is gone.
HBM is DRAM rebuilt for bandwidth: the same cells, stacked vertically and wired to the processor through a massively parallel interface. Faster feeding, far higher cost. It sits beside the GPU, not on the motherboard.
NAND is the filing cabinet. A thousand times slower than DRAM, but non-volatile and dramatically cheaper per bit. Every SSD, every phone’s storage, is NAND.
HDD and tape sit at the bottom: mechanical, slow, and by far the cheapest way to keep a bit alive. The cloud’s cold data lives here, and as we will see, the hard drive is very much part of this story.
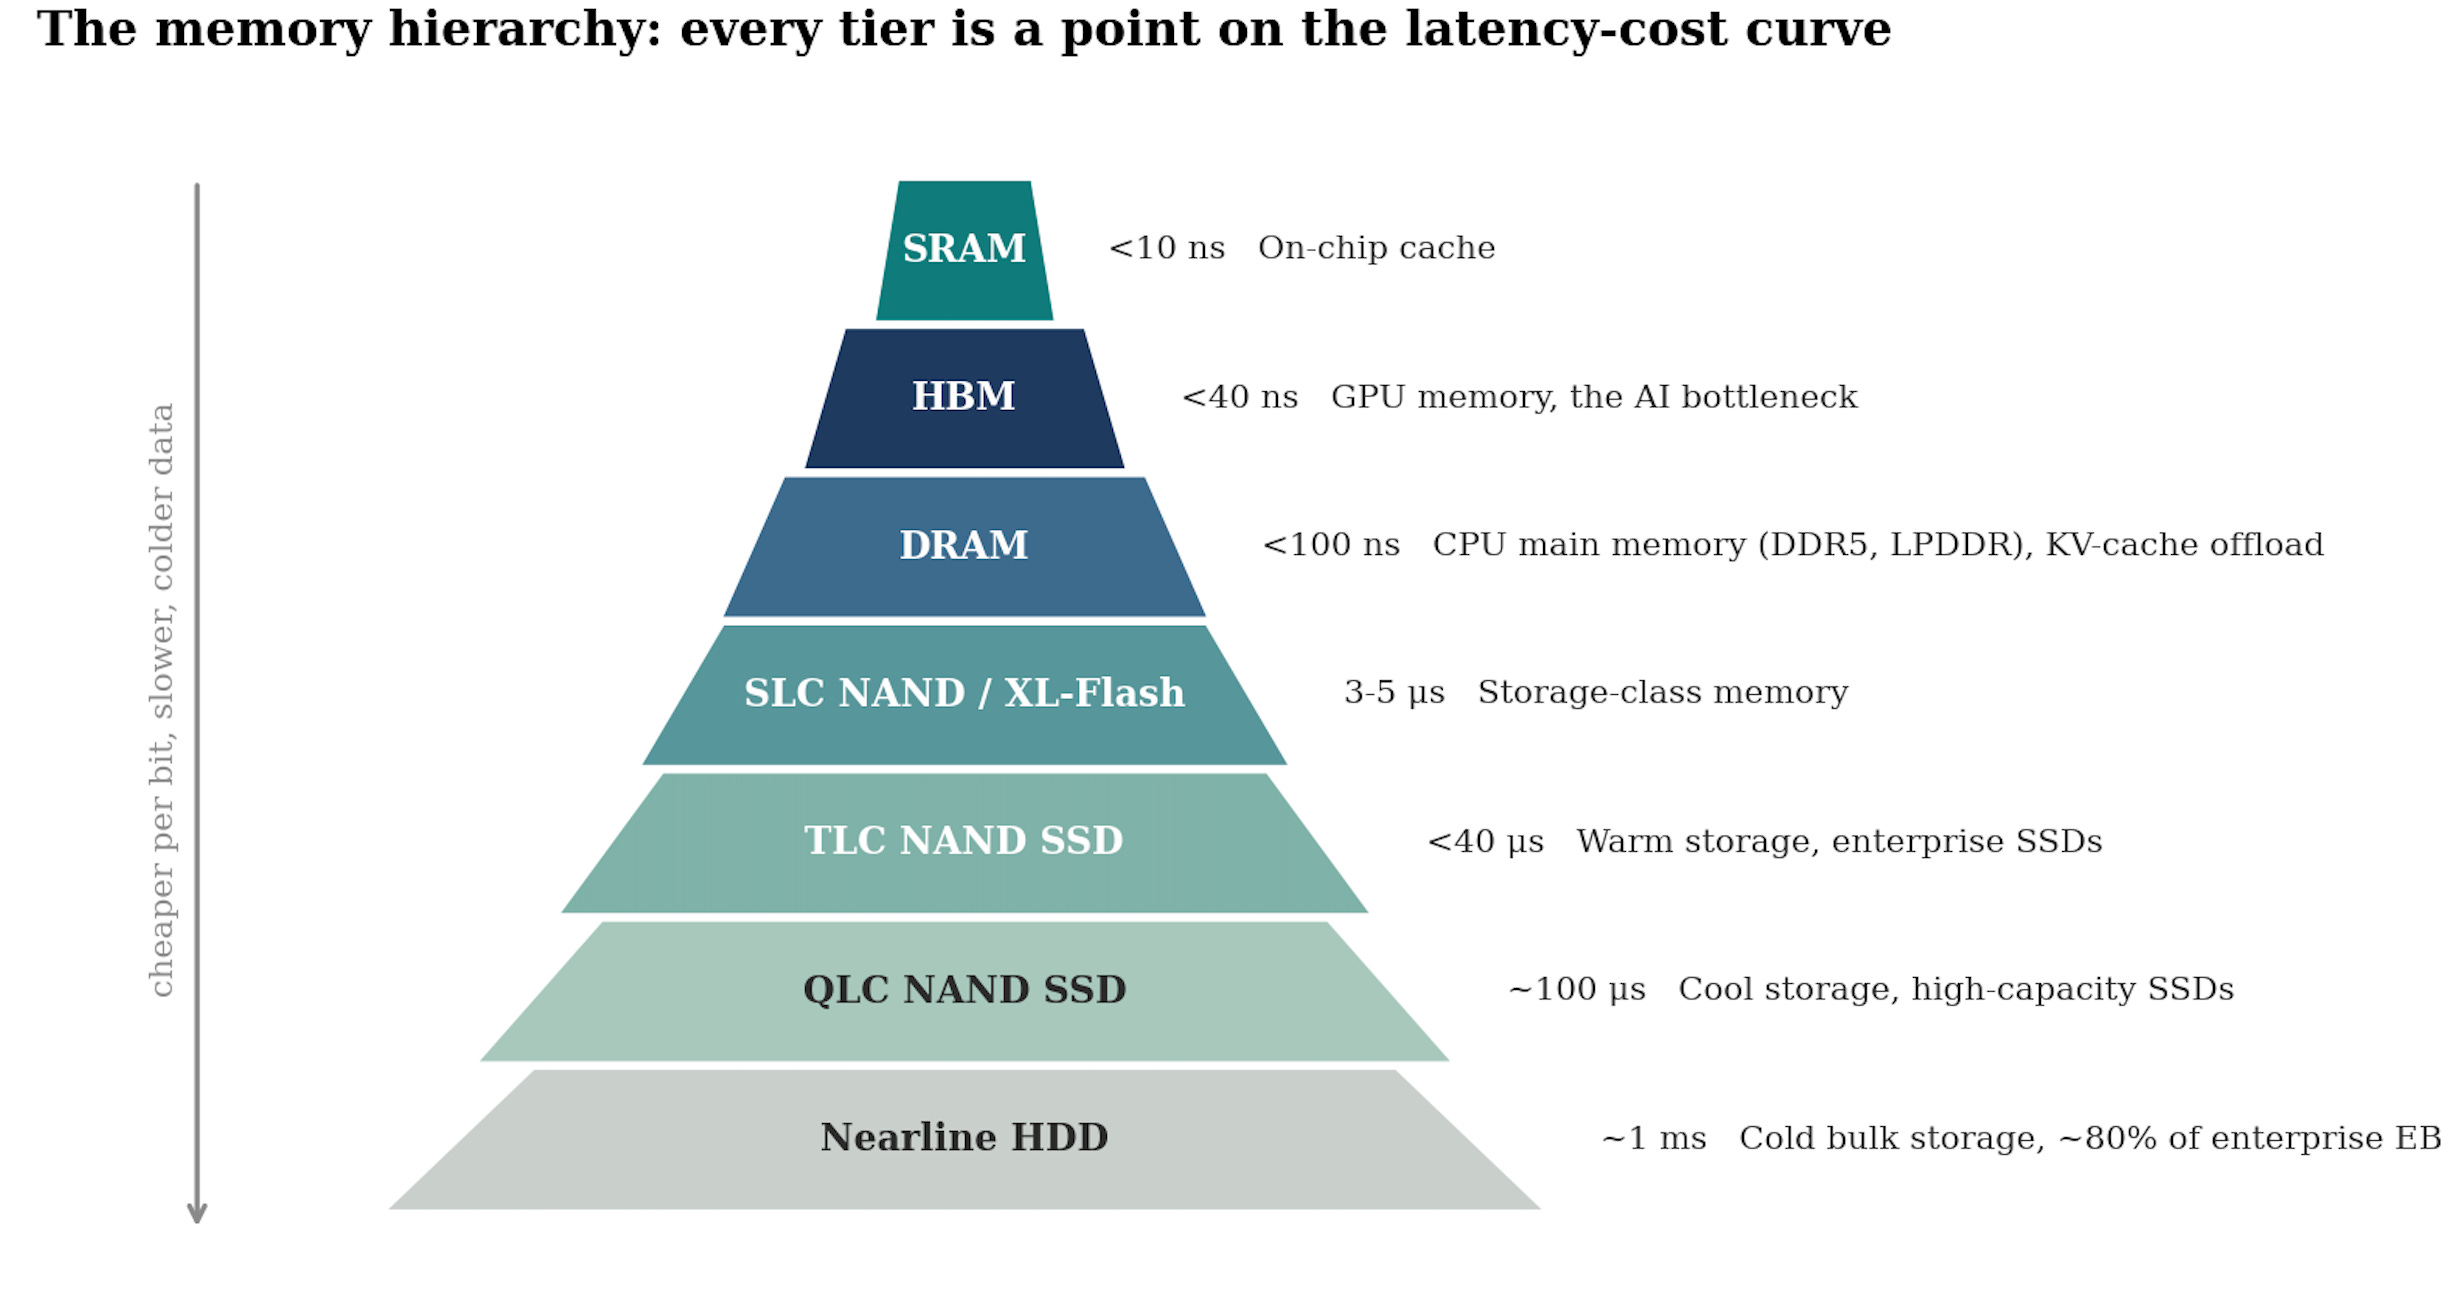
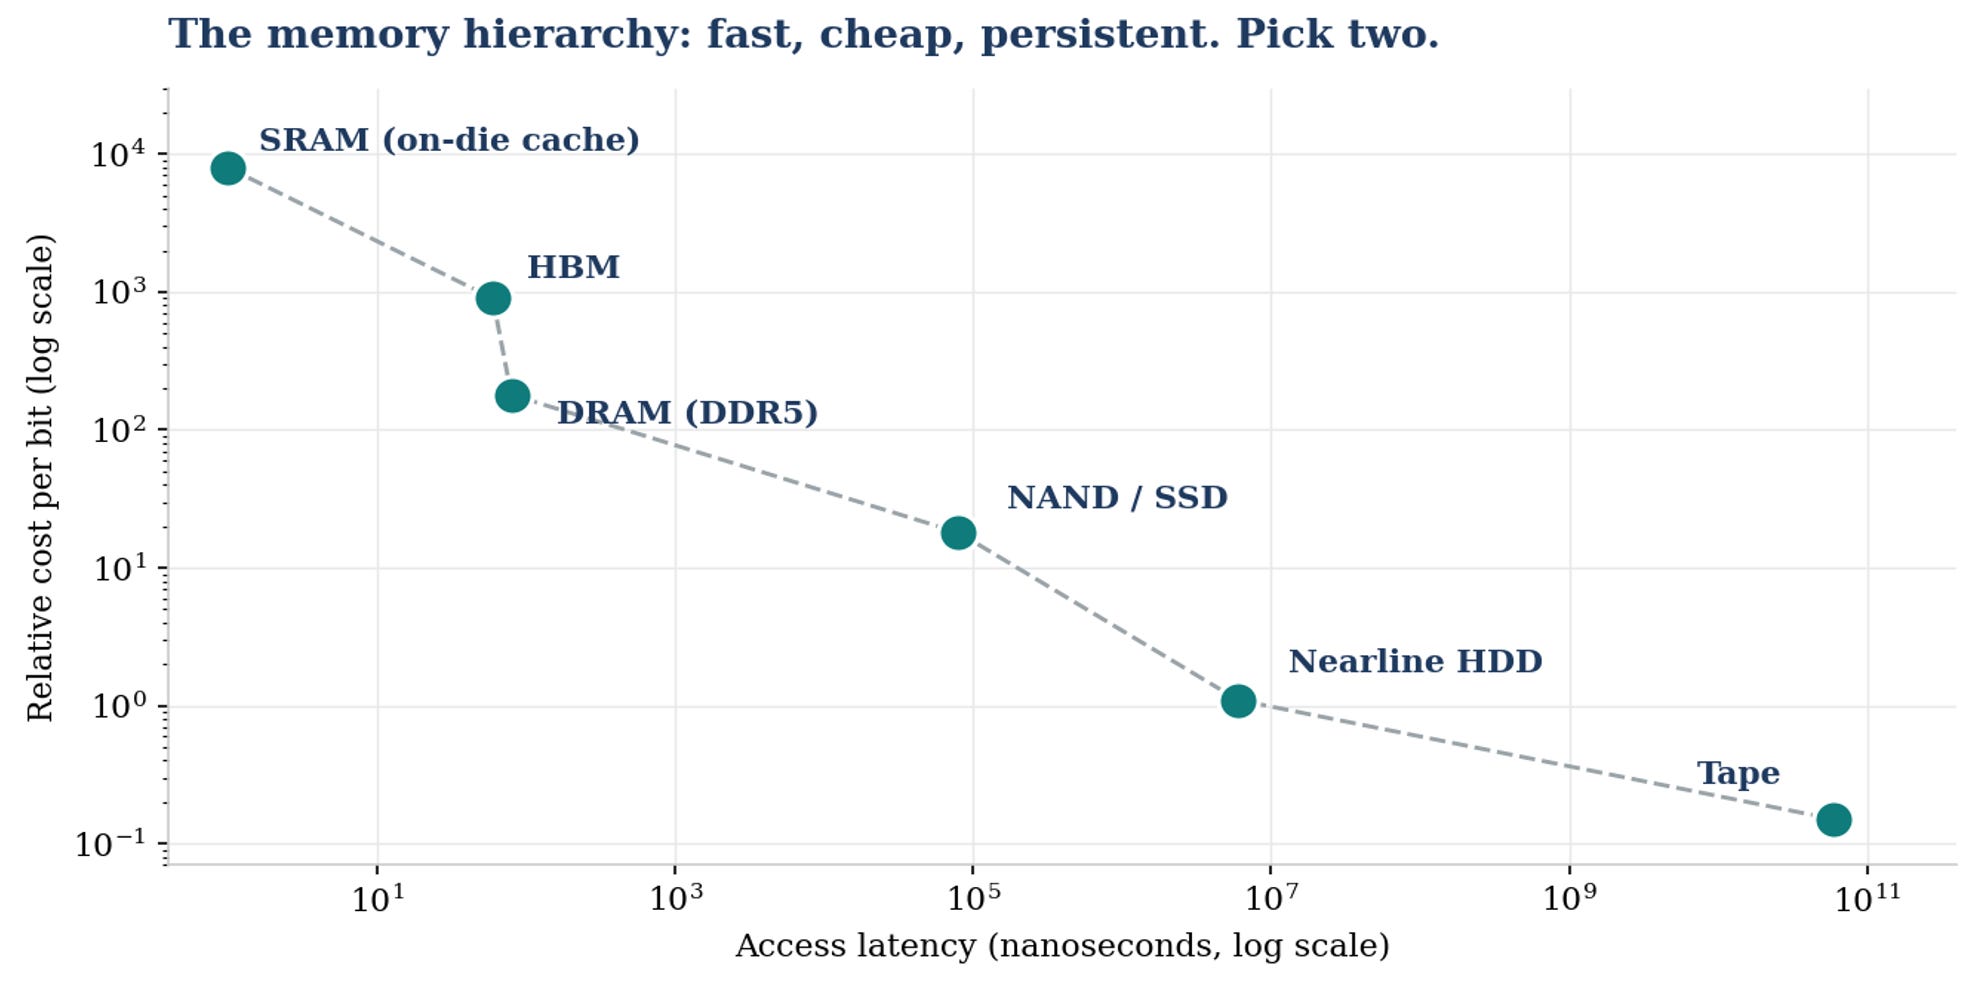
Every memory product is a point on the latency-cost curve. The hierarchy exists because physics will not let one product occupy the whole line.
My view: Hold onto the hierarchy, because it is the frame for everything that follows and for the investment debate itself. The AI build-out is not pulling on one tier, it is pulling on all of them at once. Training and inference stress HBM, model context and serving stress conventional DRAM, checkpointing and data pipelines stress NAND, and the exhaust of it all lands on nearline hard drives. When investors argue about whether DRAM or NAND or drives are the better trade (a debate I address in Section 7), they are really arguing about which point on this curve captures the most value from the same demand wave.
For the transistor-level foundations (both for DRAM and NAND), the full manufacturing walk-through is in the Semiconductor Primer.
DRAM: the working memory of the world
The cell: one transistor, one capacitor, and a leak
A DRAM cell is the most elegant compromise in electronics: one transistor and one capacitor.
The capacitor holds a charge (a one) or does not (a zero), the transistor is the gate that reads and writes it.
That minimal design is why DRAM is dense and cheap.
The catch is that capacitors leak. Every cell forgets its contents within milliseconds, so the chip must constantly re-read and re-write every bit, thousands of times a second.
That is the D in DRAM: dynamic. It is also why DRAM dies with the power: no refresh, no data.
The physics of that capacitor is the whole DRAM scaling story:
To shrink the cell, you must shrink the capacitor, but it still has to hold enough charge to be readable.
The industry’s answer has been to build capacitors as ever taller, ever narrower cylinders, structures now so extreme in aspect ratio that they are among the hardest things fabricated by humans.
Remember this: it is why DRAM scaling is slowing, and that slowdown is one of the quiet foundations of the entire investment thesis.
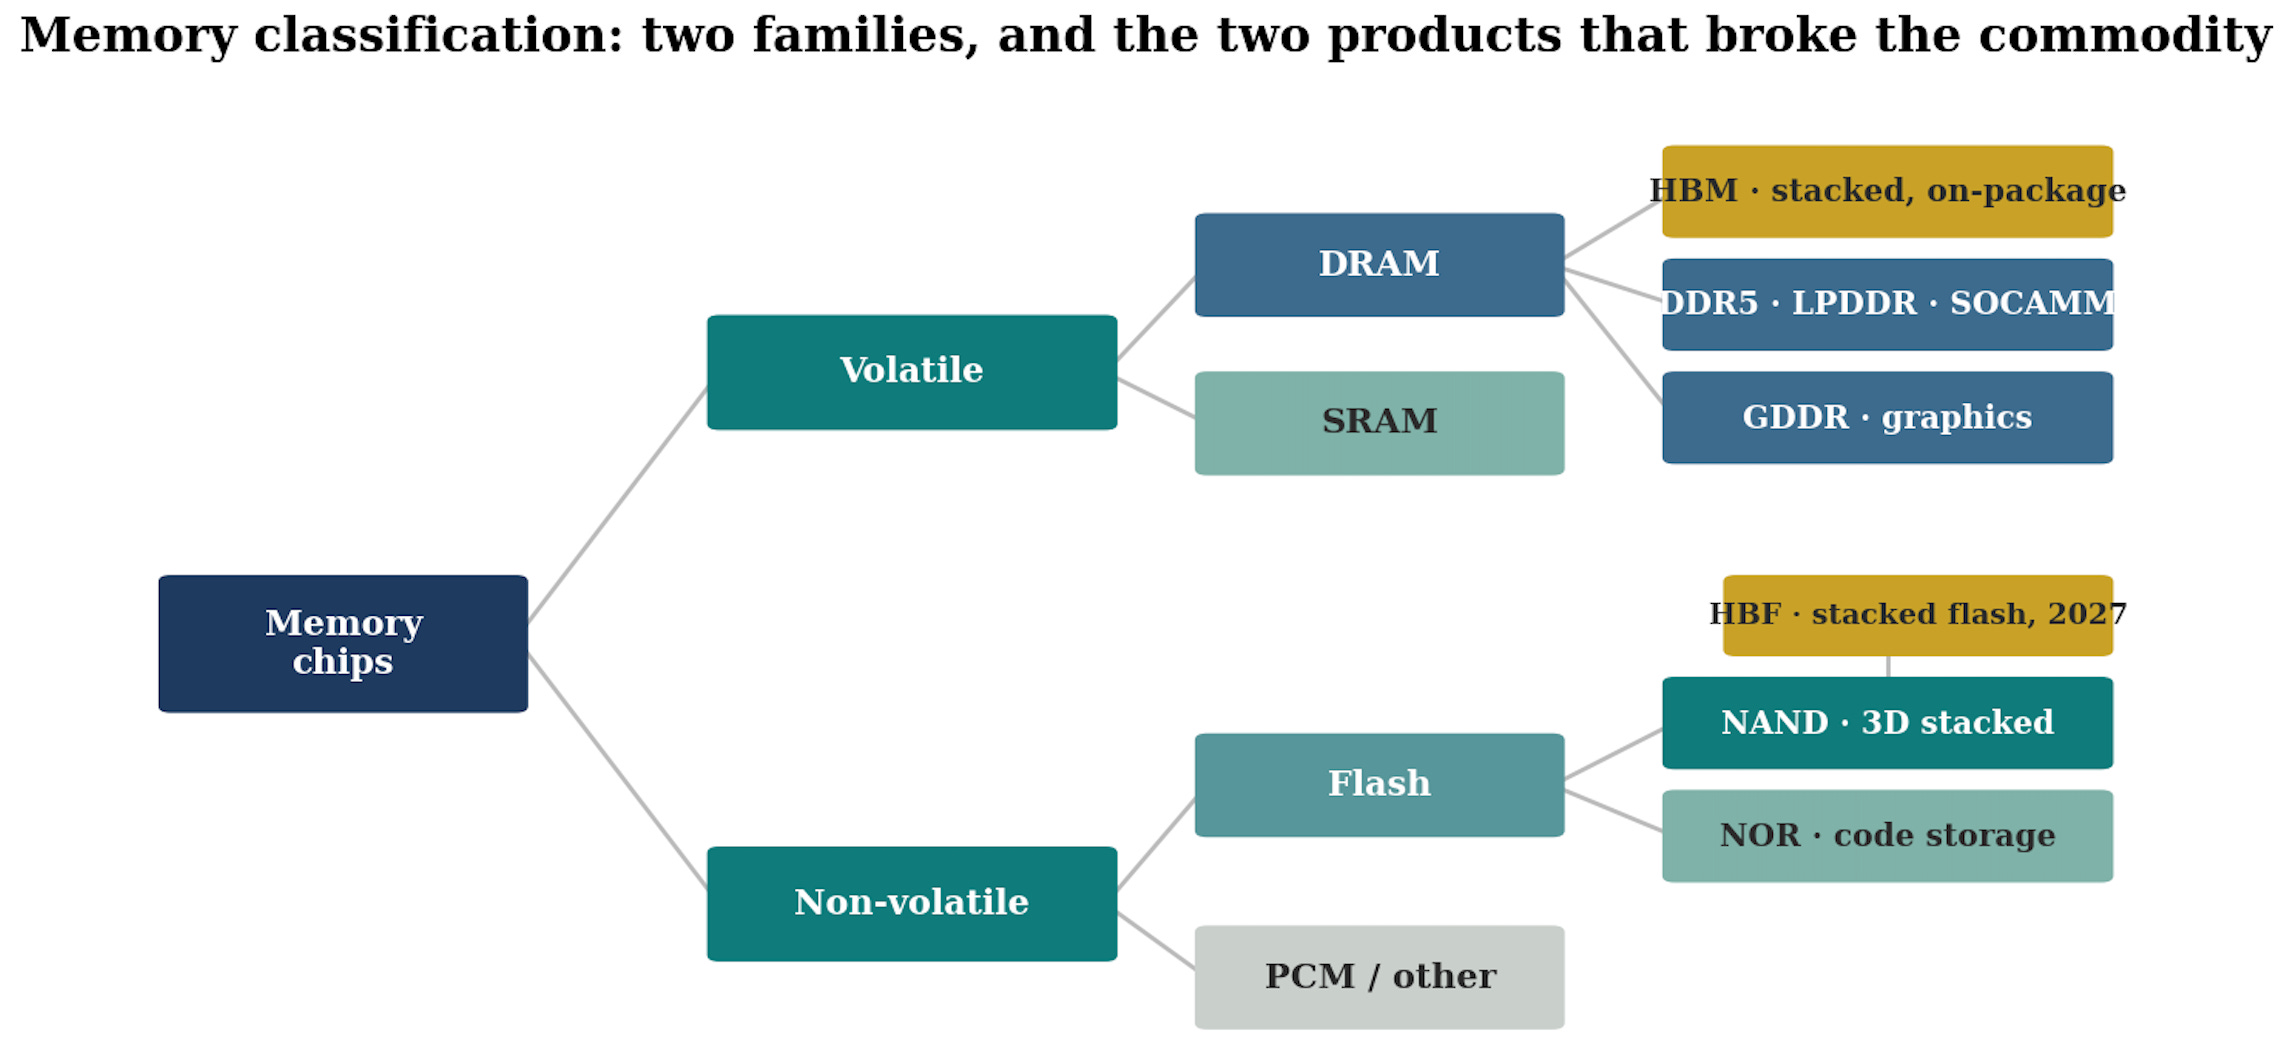
The flavours: same cell, different packaging of speed and power
DDR5 is the mainstream workhorse: server boards and desktop PCs. When people quote “the DRAM price”, they usually mean a DDR module.
LPDDR is the low-power variant that runs every smartphone, and increasingly AI servers too, where its power efficiency matters at rack scale.
GDDR is the graphics variant: higher speed per pin, soldered next to GPUs in gaming cards and some inference accelerators.
HBM is DRAM’s apex product and will be addressed in its own section below.
Nodes: the alphabet after the numbers ran out
DRAM nodes stopped being nanometre numbers years ago.
Below 20nm the industry moved to a lettered ladder: 1x, 1y, 1z, then 1-alpha, 1-beta, 1-gamma (Micron’s naming, Samsung and SK Hynix call the same generations 1a, 1b, 1c).
Each step is a modest linear shrink, roughly the 11 to 12nm class at the current leading edge.
EUV lithography entered DRAM around the 1a generation and its layer count grows each node: Micron’s 1-gamma, in volume production since the first half of 2025, is its first EUV node, and Samsung is converting legacy lines to 1c as fast as it can.
What matters for investors is the yield of each step.
A DRAM node shrink now delivers perhaps 15 to 25% more bits per wafer, versus 40%+ in the old days, at a higher equipment cost per wafer.
The road ahead makes this harder still: the next structural moves are 4F2 cell architectures with vertical channel transistors, and eventually true 3D DRAM, stacking cells the way NAND does, expected in the 2030s. Each is a bigger re-tooling for a smaller bit gain.
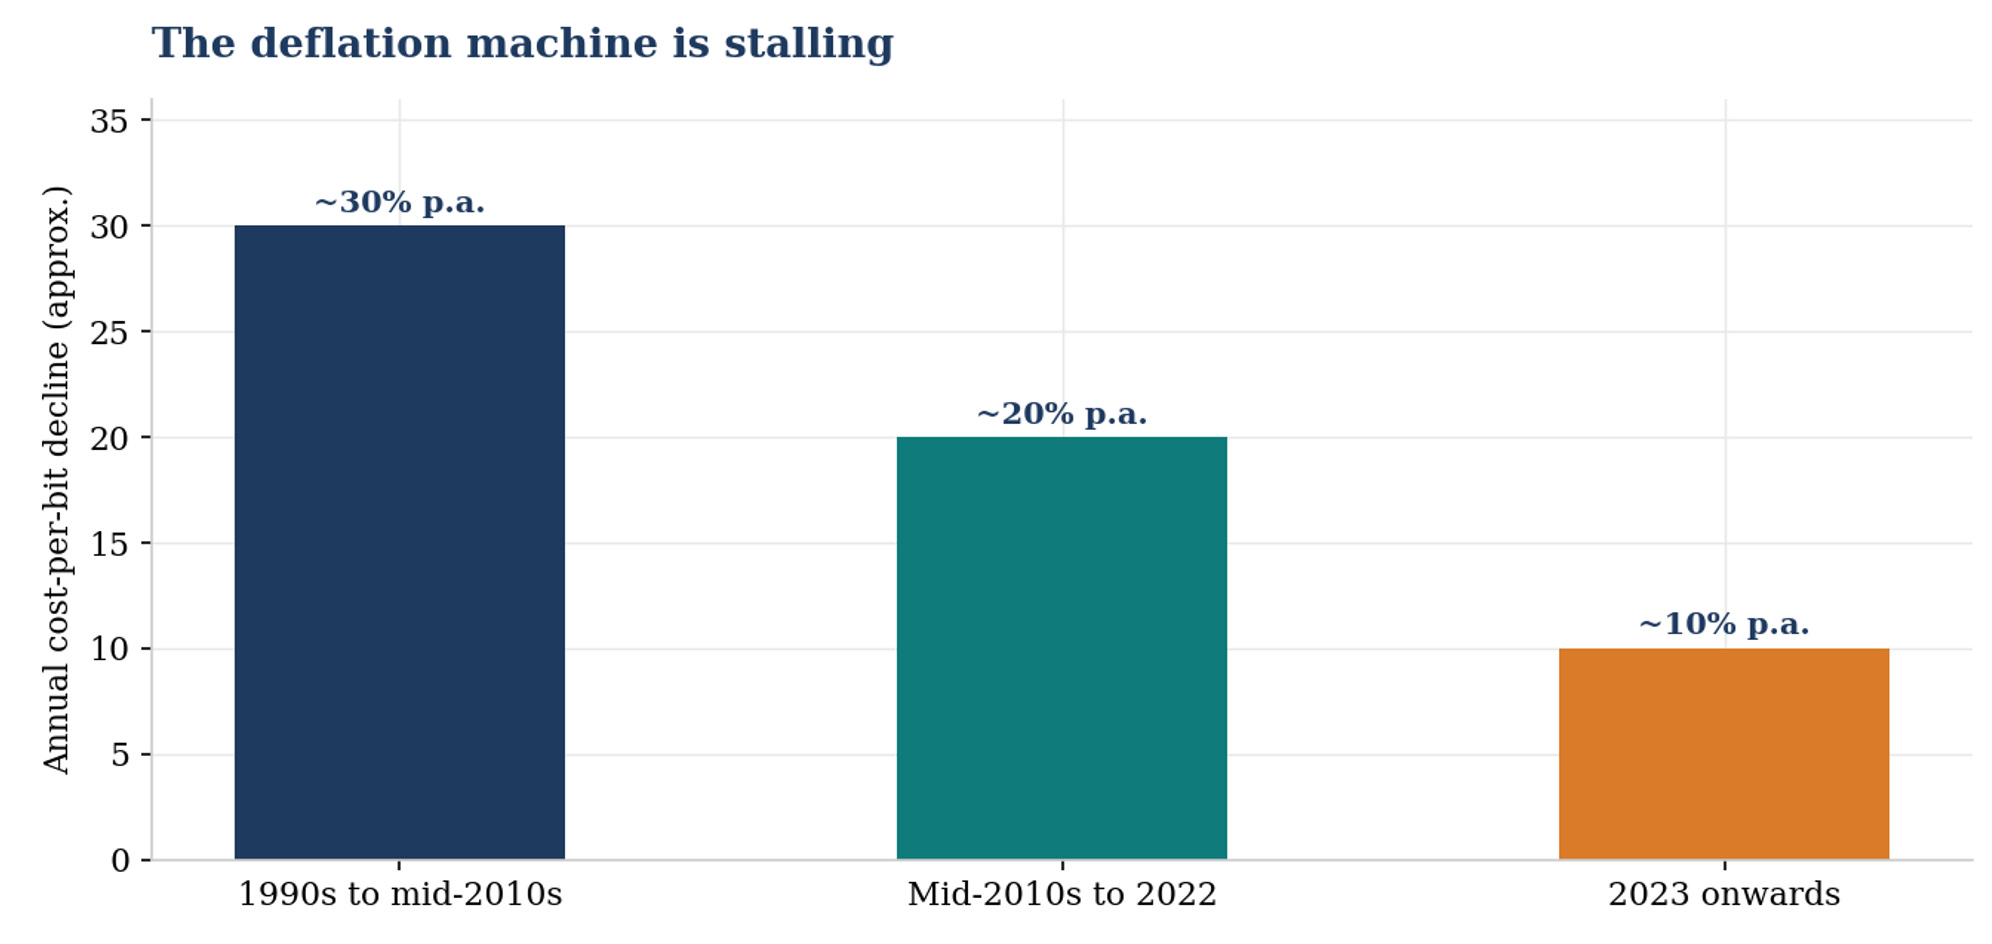
The deflation machine is stalling. Four decades of roughly 30% annual cost-per-bit decline is what kept memory a commodity, that engine now runs at a third of its old speed.
My view: The slowing cost curve is, quietly, the most structurally bullish fact in this entire primer, and almost nobody frames it this way. For four decades, memory makers destroyed their own prices because cost-per-bit fell about 30% a year, so they could cut price 25% and still expand margin, and every glut was eventually cured by deflation. When cost only falls about 10% a year, the deflation machine stalls: price floors rise, gluts are no longer self-curing through cost, and incremental supply must come from expensive new wafers rather than free shrink. Half of the singularity thesis rests on demand, this is the supply half, and it is set in physics.
NAND: the memory that remembers
The cell: trapping electrons behind a wall
NAND stores a bit by trapping electrons in an insulated layer inside the transistor itself (a charge trap, historically a floating gate).
Because the electrons are physically imprisoned rather than refreshed, the data survives without power. That is the entire magic of flash.
The price of the magic is wear: forcing electrons through the insulating wall damages it, so every NAND cell survives only a finite number of program-erase cycles.
The industry manages this with controllers and over-provisioning, but endurance is the fundamental constraint of the technology.
Bits per cell: the density lever nobody loves
A cell trapping charge can distinguish more than two levels.
Store one bit per cell (SLC) and it is fast and durable.
Store three (TLC, today’s mainstream) or four (QLC) and each cell must distinguish 8 or 16 charge levels, so it gets slower, less durable, and much cheaper per bit.
QLC is how the industry attacks the hard drive from above, the interesting wrinkle is that high-layer TLC has become dense enough to compete with QLC on cost while beating it on endurance, which is exactly how the leading data-center drives are now positioned.
The layer race: NAND’s Moore’s Law is vertical
In 2013 NAND hit the wall DRAM is approaching now: cells could not shrink further in the plane.
The industry’s answer was the most audacious pivot in semiconductor history: stop shrinking and start stacking. 3D NAND builds the memory as vertical strings, hundreds of layers of cells threaded on channels etched down through the stack.
The layer count is now the node: from 24 layers in 2013 to 176, then 232, 276, 286-layer and 321-layer generations at the 2026 leading edge, with 332-layer and 400-layer roadmaps arriving from 2027.
Because a single etch must drill through the entire stack, makers now build in storeys: two or three decks string-stacked on top of each other.
The frontier technique is wafer-to-wafer hybrid bonding: manufacture the memory array on one wafer and the logic periphery on another, polish both to atomic smoothness, and fuse them face to face.
A Chinese maker, YMTC, pioneered the approach commercially, and it is now spreading through the industry for 300-layer-plus generations, with Samsung reportedly licensing hybrid bonding IP for its 400-layer roadmap.
Keep this in the back of your mind for the value chain section: the same hybrid bonding tools are the heart of advanced packaging, which makes their suppliers one of the cleanest picks-and-shovels expressions of the whole theme.
My view: NAND is structurally the tougher business, and it is worth understanding why, because it will come back in the selection piece later in the series. Five clusters compete instead of DRAM’s three, layers keep delivering bit growth without new lithography, so supply is easier to add, and demand is more elastic, since cheap bits create their own consumption. That is why NAND margins run structurally below DRAM. The counterweight is that each layer doubling now costs materially more in etch and deposition per bit than the last, and the AI inference wave is pulling enterprise SSD demand up the hierarchy. NAND is a worse business than DRAM, improving, DRAM is a better business, de-commoditising.
HBM: the skyscraper that broke the commodity
HBM exists because compute has outrun the bandwidth that feeds it.
A modern accelerator can perform arithmetic far faster than data can be moved in and out of memory, the industry calls this the memory wall, and it means AI systems are memory-bound, not compute-bound. HBM is the answer, and its construction is its economics.
How you build one
Take DRAM dies, but designed for width: instead of talking to the processor through tens of wires, an HBM stack connects through a 1024-bit interface, doubling to 2048-bit in HBM4. Bandwidth through parallelism, not clock speed.
Thin each die to a fraction of a human hair, drill thousands of through-silicon vias (TSVs), vertical copper elevators, through each one.
Stack them 8, 12, and with HBM4 16 dies high on top of a base die that manages the traffic, and bond the tower together. The competing assembly methods (mass-reflow moulded underfill versus thermo-compression with film, with copper-to-copper hybrid bonding on the roadmap) are themselves a competitive battleground, and stacking yields are a guarded secret that separates the leader from the laggards.
Mount the finished stacks millimetres from the GPU on a silicon interposer, the 2.5D packaging (CoWoS at the leading foundry) that is itself one of the AI build-out’s great bottlenecks.
Each generation roughly doubles bandwidth per stack while capacity climbs through height: from 24GB stacks in early HBM3E to 36GB in 12-high and 48GB in HBM4’s 16-high.
The trade ratio: the number that runs the industry
Because HBM dies are larger and lower-density, because TSV area and stacking overhead eat silicon, and because yields on a tall stacked part are structurally lower, producing a bit of HBM consumes far more wafer capacity than the same bit of commodity DRAM.
The industry calls this the trade ratio, and it is rising with every generation: roughly 2.6x for HBM3E 12-high versus DDR5 on the same node, 3.2x for HBM4, and 3.7x beyond.
This single number is the engine of the silicon-intensity flywheel: it is why HBM at roughly 15-20% of bits already absorbs close to 40% of DRAM wafer capacity, and why every step up the HBM roadmap tightens the commodity market further.
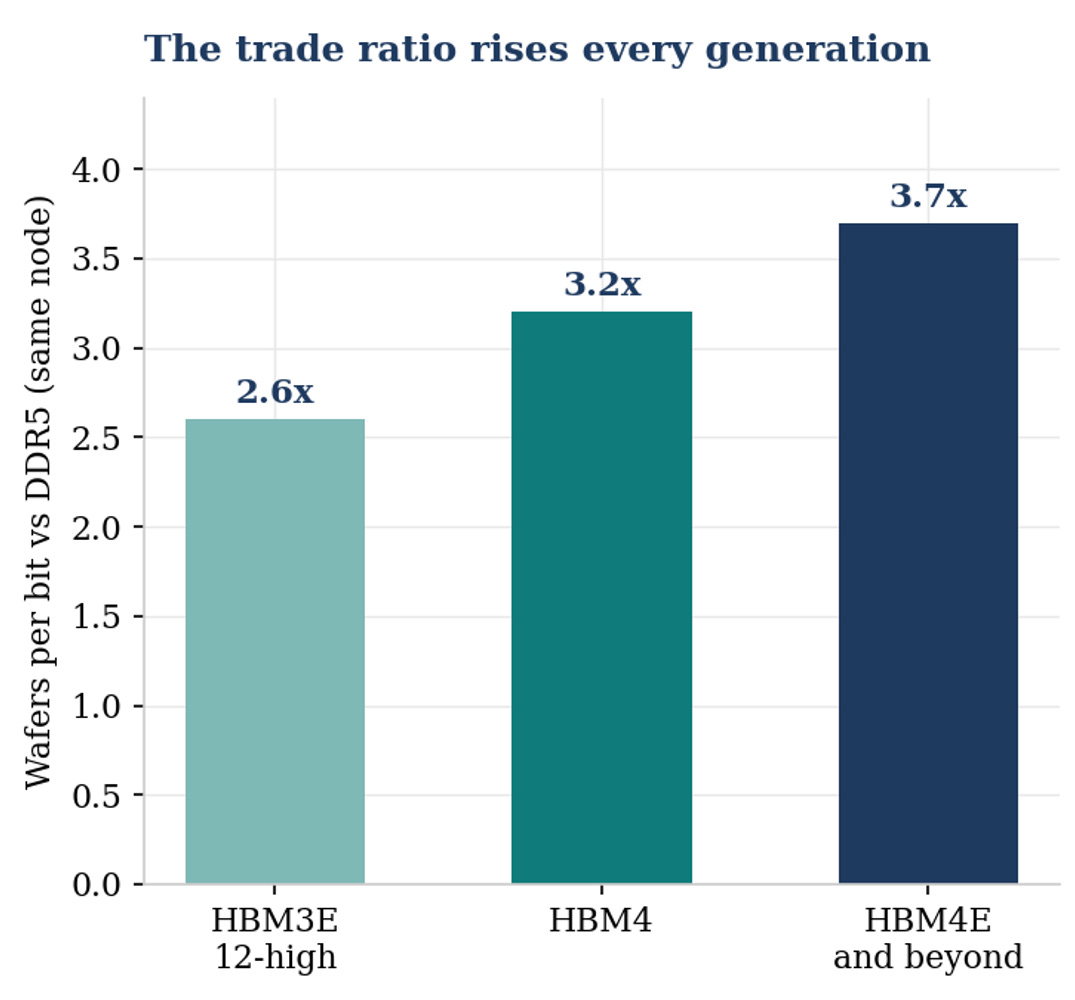
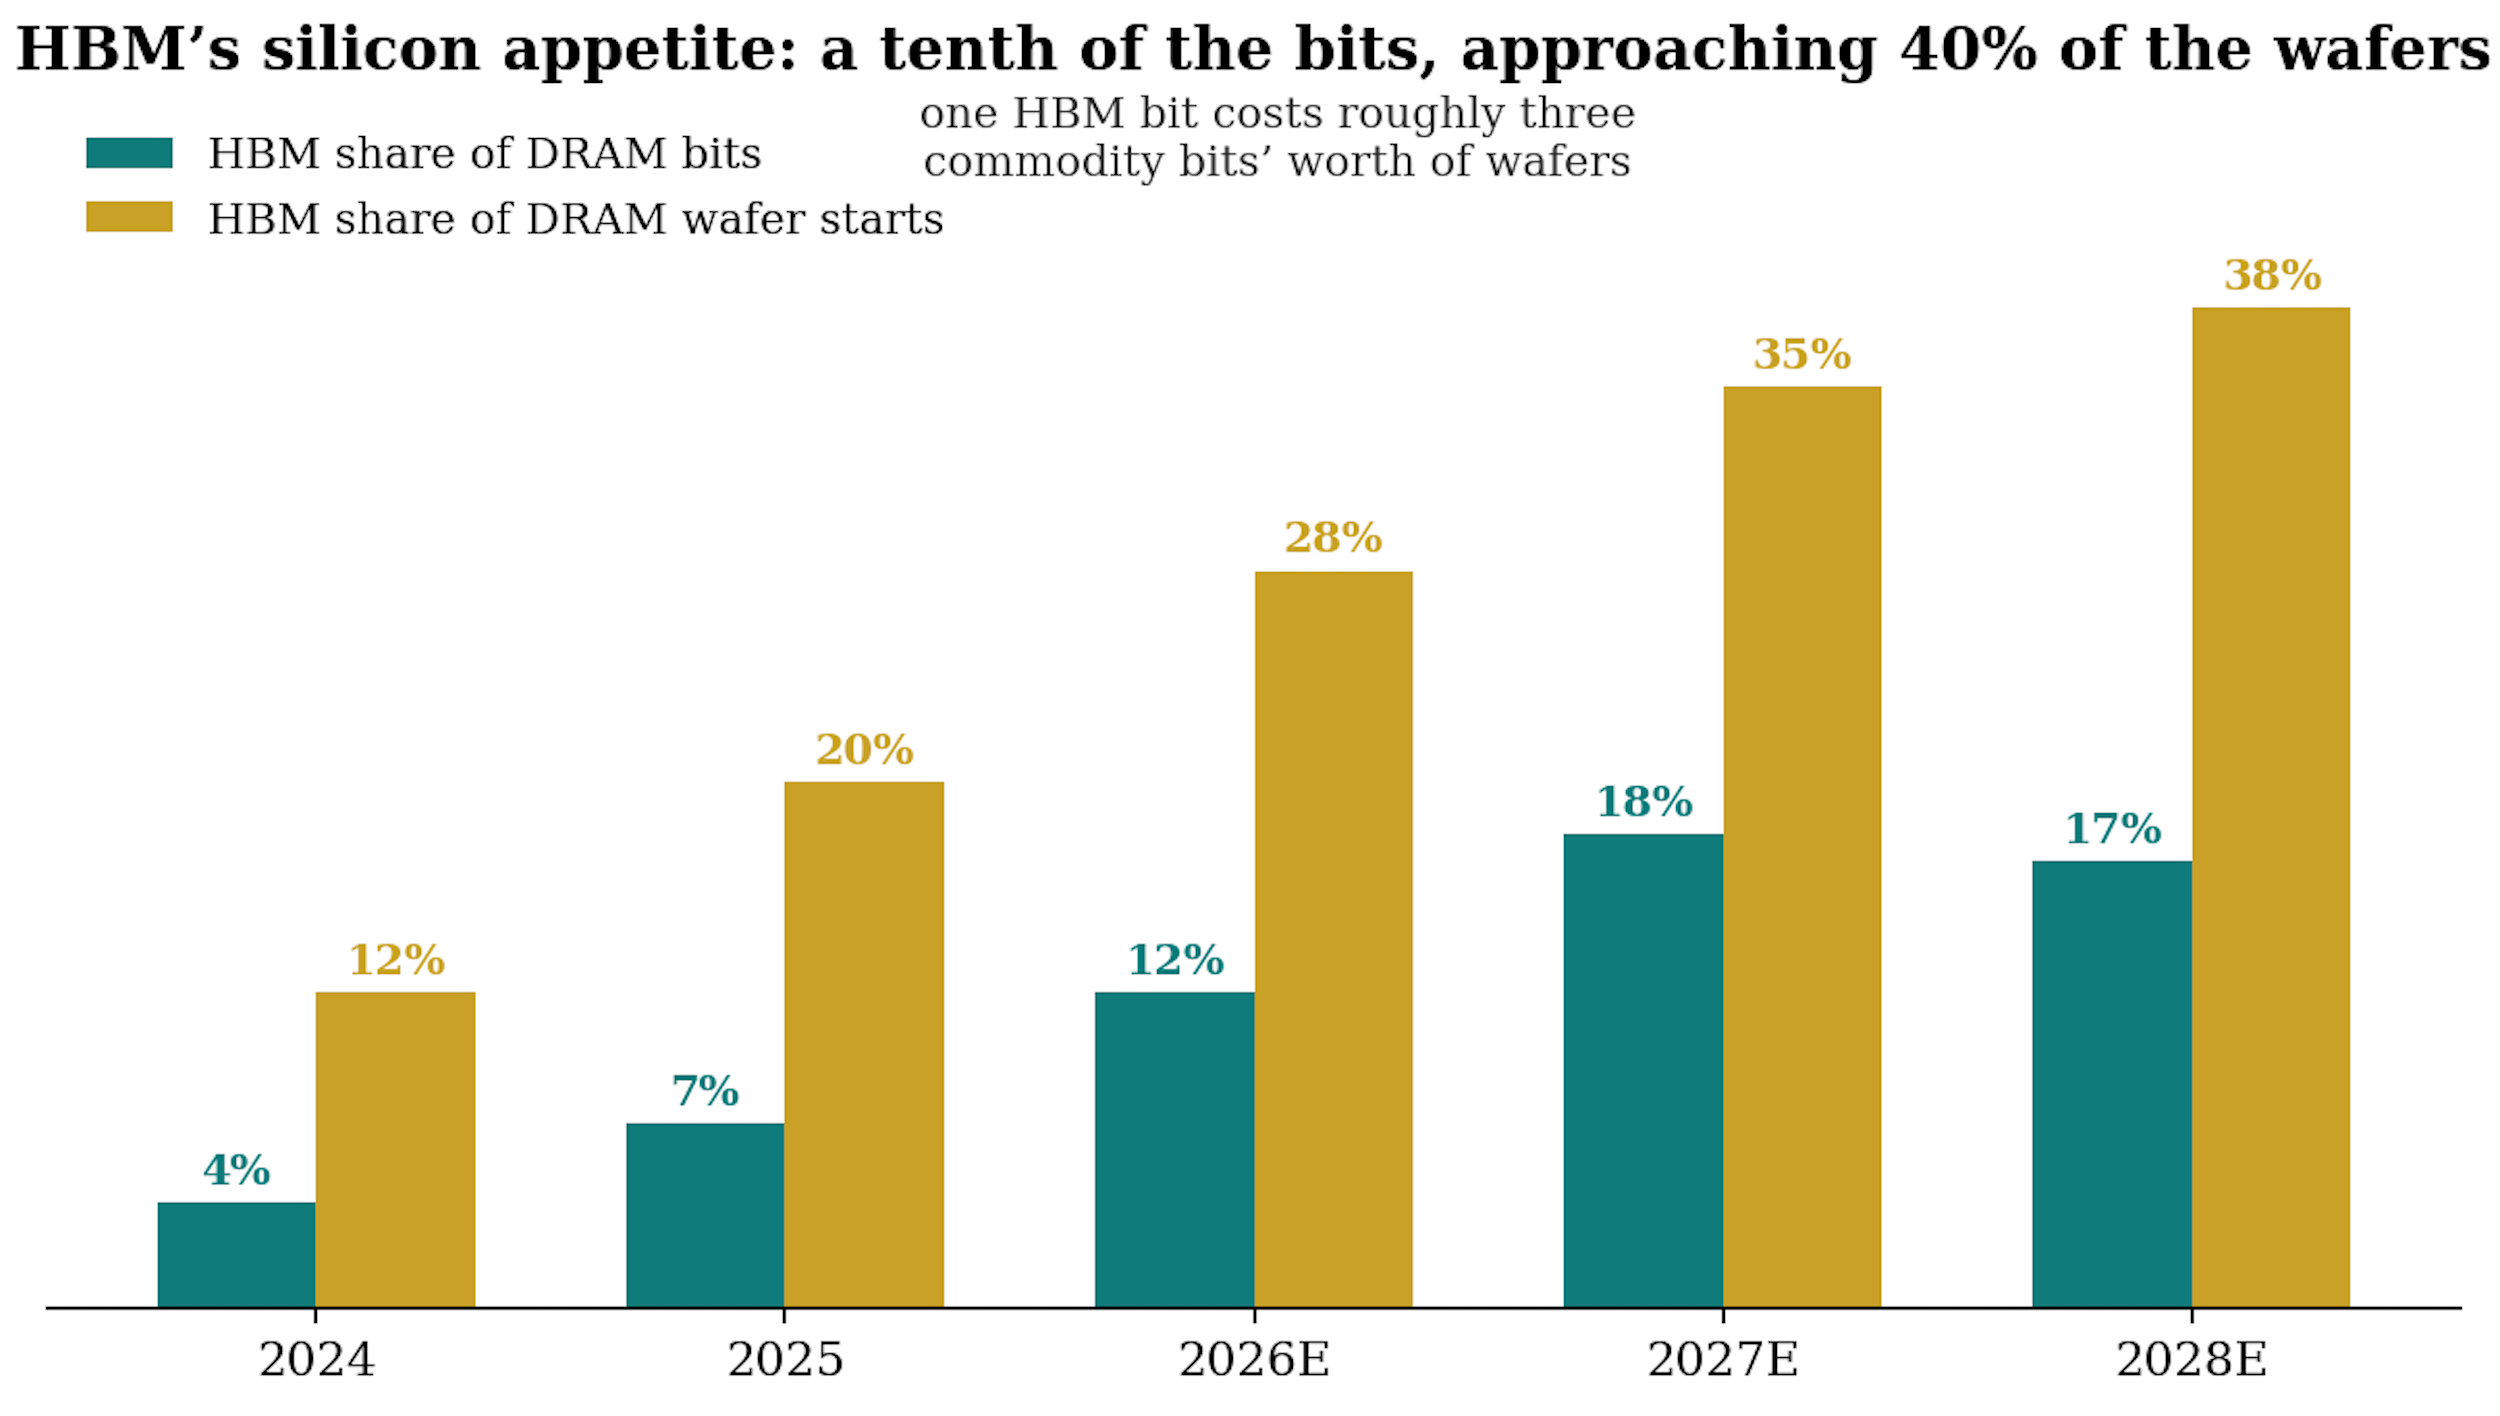
The trade ratio rises every generation. One HBM4 bit costs the industry more than three DDR5 bits’ worth of wafers, and that is before the yield gap between makers.
My view: Watch the HBM4 base die, because it is the singularity thesis in miniature. Through HBM3E, the base die at the bottom of the stack was a DRAM-process part the memory maker built itself. From HBM4, it migrates to a logic process, designed with the customer and in some cases manufactured by the leading foundry, and beyond that lies fully custom HBM co-designed for a specific accelerator. Sit with what that means: a memory product with customer-specific logic, multi-year design-in, foundry involvement and qualification cycles measured in quarters is not a commodity by any definition. It cannot be second-sourced, it cannot be dumped on a spot market, and its price is set in negotiation, not discovery. When people ask what de-commoditisation concretely means, this is the answer.
How memory is made, and what it costs
A memory fab uses the same fundamental toolkit as a logic fab (deposition, lithography, etch, clean, repeat, as covered in my semiconductor equipment primer) but with a very different mix.
The full economics of a leading-edge fab, and why buildings fabs take four years, are covered at length in the Semicap Primer.
DRAM’s signature challenge is the capacitor: extreme-aspect-ratio etch, exotic deposition, and now a growing count of EUV layers at the leading edge.
NAND’s signature challenge is the channel: drilling billions of holes through hundreds of stacked layers, which makes it the most etch and deposition-intensive product in semiconductors, and the one major chip that needs no EUV at all.
A finished wafer takes roughly three months and many hundreds of process steps, the raw silicon disc that costs a few hundred dollars leaves the line worth tens of thousands.
A leading-edge greenfield memory fab is a $20bn-plus commitment with a roughly two-year build and qualification lead time. That lag between a demand signal and new supply is the metronome of the memory cycle.
Memory capex runs on the order of 35% of sales through the cycle, among the highest capital intensities in any industry, which is why balance sheets and capex discipline decide who survives downturns.
Scale decides everything: this is why the industry consolidated from dozens of makers to three in DRAM, and why entry (China aside, with the state absorbing the economics) is essentially closed.
Memory competition reduces to one number: cost per bit. DRAM lowers it by shrinking (slowing, as we saw), NAND lowers it by stacking (still working, but at rising cost per layer).
Everything in the industry, node roadmaps, layer races, the HBM mix shift, is legible as a move on the cost-per-bit scoreboard or a retreat from it. The strategic novelty of the current era is that the leaders are for the first time competing on value per bit instead: steering wafers into HBM, where the price premium beats the cost premium, rather than racing each other to the bottom of the commodity curve.
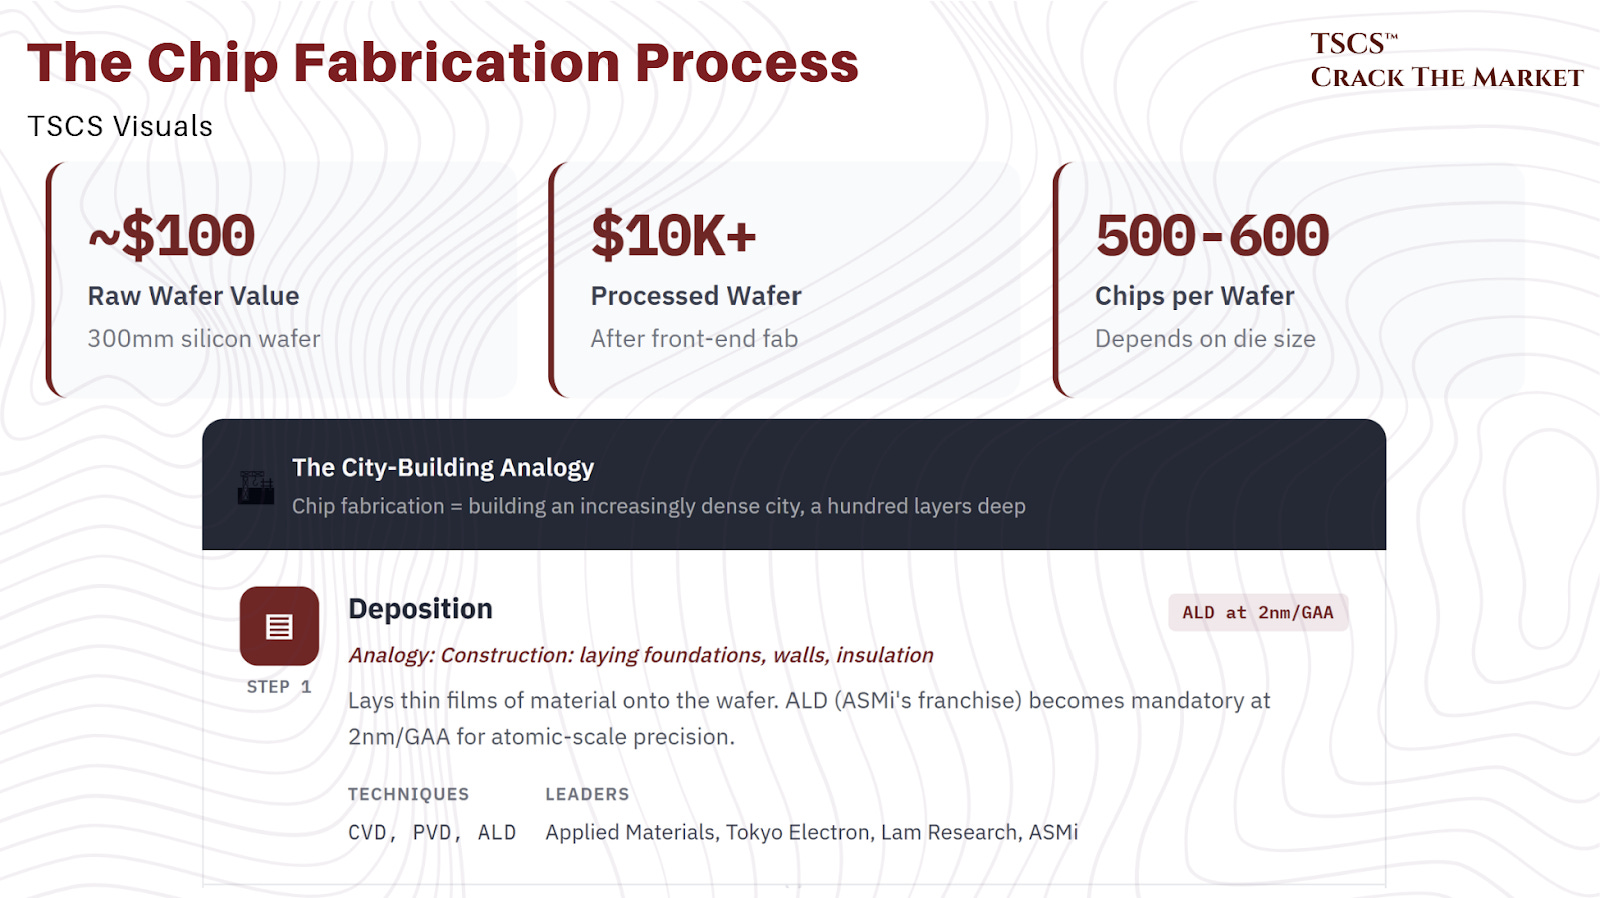
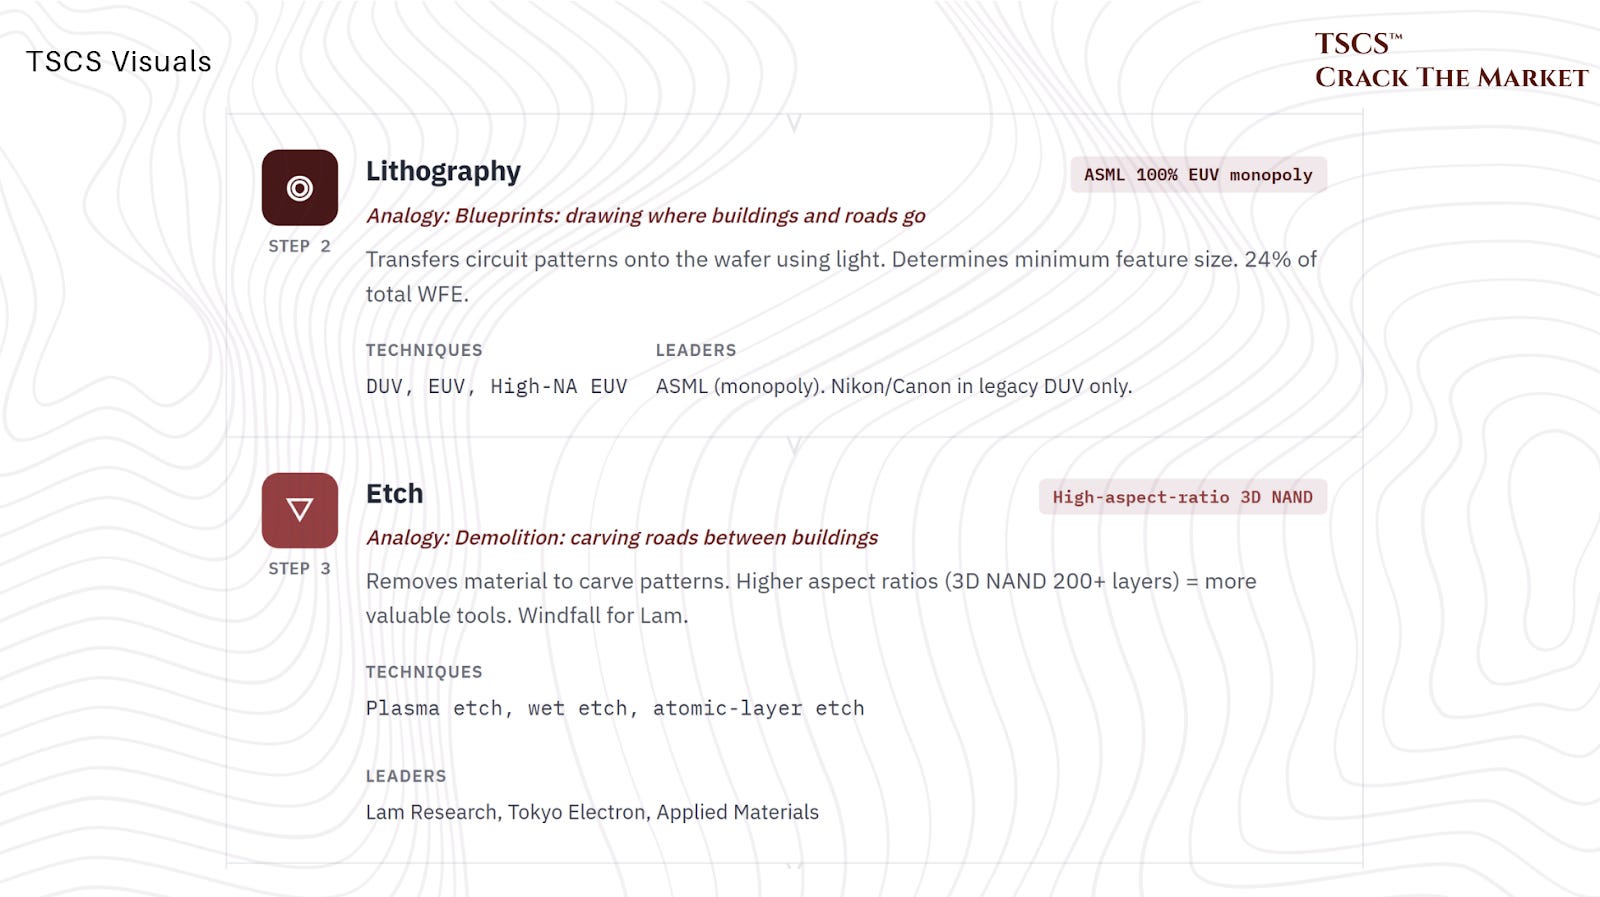
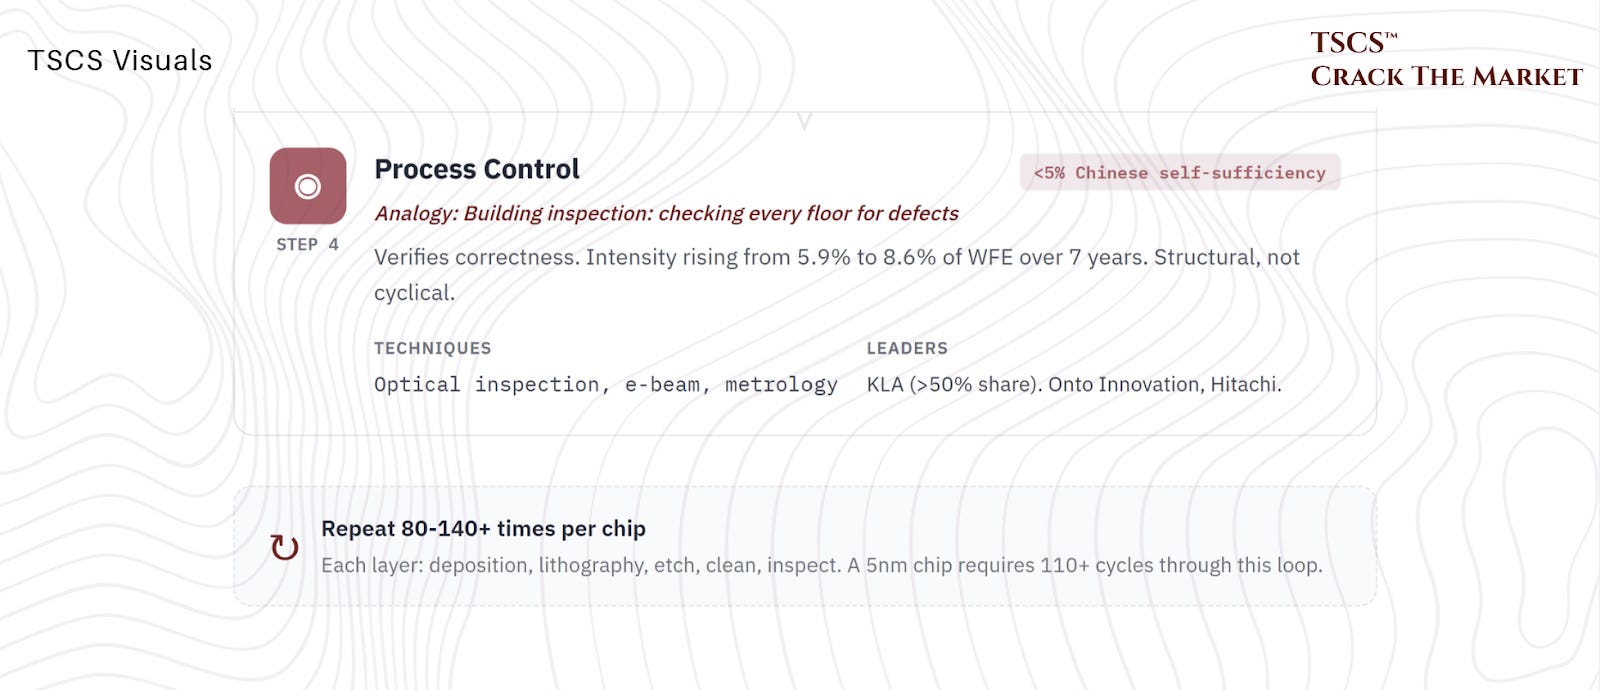
How do you make a chip?
Making a chip is conceptually simple. You draw a pattern (lithography), build structures (deposition), carve away what you do not need (etch), clean up the mess, and repeat. A hundred times. With nanometer precision. On a surface area smaller than your thumbnail.
The analogy that works best: chip fabrication is building a city. Lithography draws the blueprints on the ground, showing where buildings, roads, and sewers will go. Deposition and etch actually construct the buildings and roads.
As the city gets denser (smaller transistors), the blueprints require finer resolution (ASML’s EUV). As the buildings get thinner and taller (high-aspect-ratio structures in 3D NAND and GAA transistors), the construction materials and techniques must get more sophisticated (ASMi’s ALD, Lam’s advanced etch).
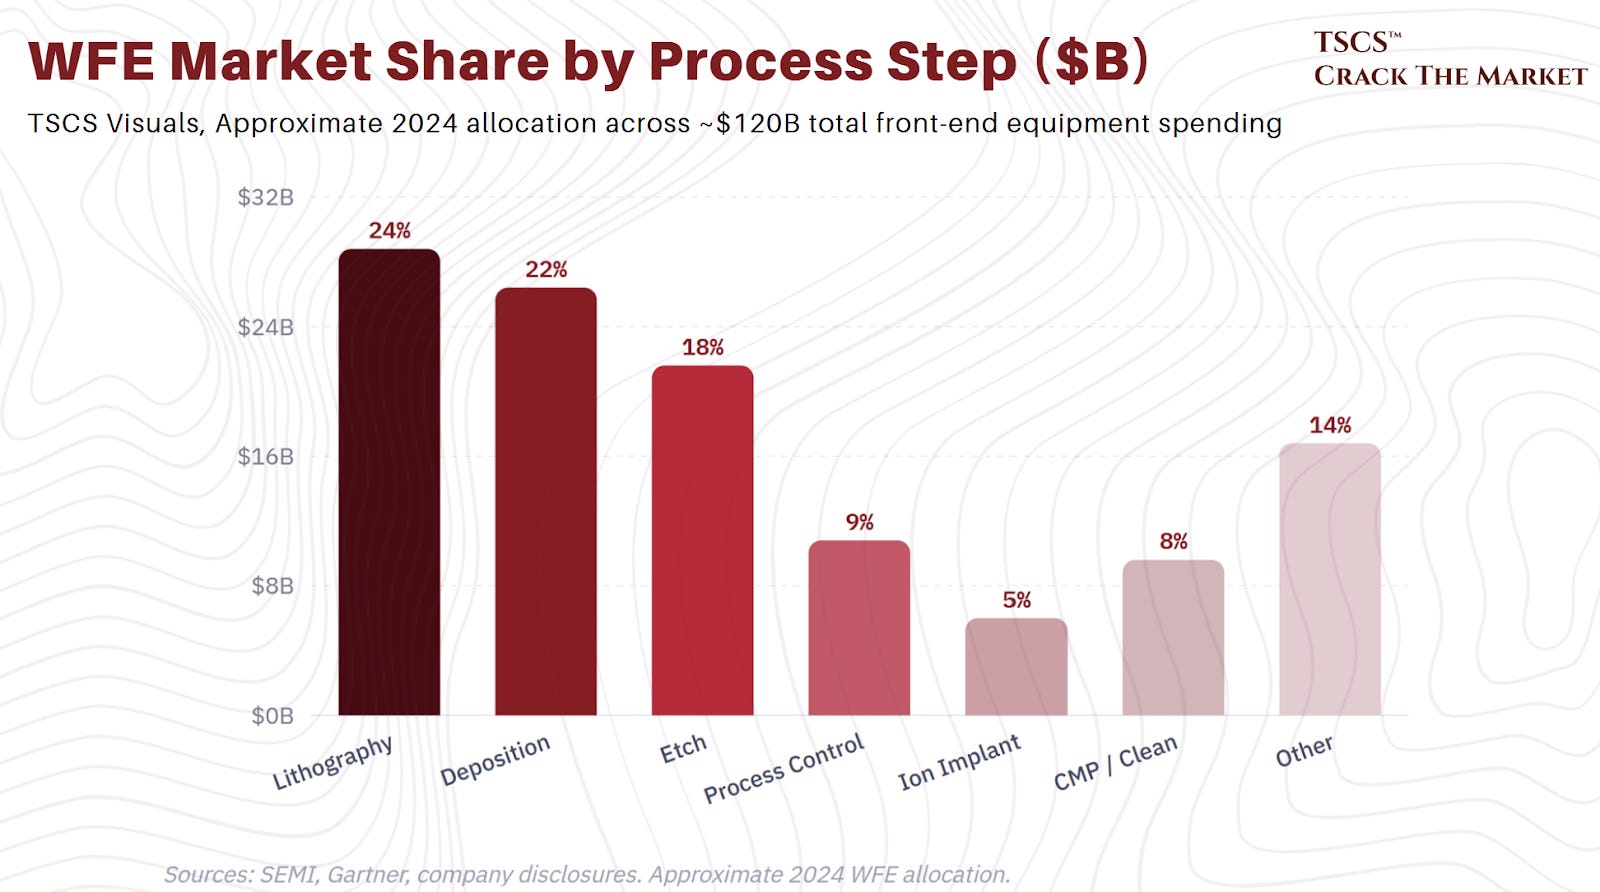
The conversion from a raw silicon wafer (worth roughly $100) to a processed wafer (worth tens of thousands of dollars) containing 500 to 600 chips is the front-end manufacturing process. The subsequent slicing, packaging, and testing of those chips is the back-end. Both require specialized equipment, but the front-end is where the overwhelming majority of WFE spending occurs.
How memory is priced: spot, contract, and the signals
The contract market is where a large portion of volume trades: quarterly (increasingly monthly, in tight markets) negotiations between makers and large buyers, the hyperscalers, phone and PC OEMs. Contract prices are what drive maker revenue.
The spot market is the marginal market: module houses, distributors and brokers trading smaller volumes daily. It is a fraction of industry bits but it is the price signal, moving instantly on sentiment while contracts reset with a lag.
The trackers: industry price services publish daily spot indices and monthly contract assessments per part (a 16Gb DDR5 chip, a 512Gb TLC NAND wafer). These series, plus maker inventory weeks and the supply-demand “sufficiency ratio” (negative means undersupply), are how professionals read the cycle in real time.
The relationship between the two markets is the single best cycle gauge:
In a glut, spot trades below contract and buyers defer, in a shortage, spot trades at a premium and the premium leads contract resets higher.
As of mid-2026 the gauges are at historic extremes: DDR5 spot prices are up close to 700% year on year and sit 30 to 40% above contract, contract resets are landing at up to 80 to 90% quarter on quarter for some products, and sufficiency ratios are running deeply negative through 2026 and 2027 estimates.
You do not need anyone’s opinion to know what regime you are in, the spread tells you.
Why does the cycle exist at all? It is a machine with three gears:
Supply is inelastic, because a fab takes multiple years, so it always arrives late.
The product was historically undifferentiated, so price was the only competitive weapon and it moved violently to clear the market.
And costs are overwhelmingly fixed, so makers keep fabs running even below cash cost in a glut, deepening every bust.
Demand shocks enter this machine and come out amplified: that is the entire boom-bust history of memory, and it is why the group’s earnings multiples compress at every peak, because the market has learned to expect the ending.
My view: This is why it is so key to watch the spot-contract spread and the sufficiency ratio, and ignore almost everything else. Headlines lag both. Spot flipping to a discount while inventories build is the earliest honest signal a cycle is turning, and it fired ahead of every prior peak, the same gauges today are still signalling deep shortage. The new contract regime (with the arrival of LTAs), covered in Section 4, does not retire these tools, it adds one: contract coverage and floor renewals, disclosed by the makers each quarter, which is now the third dial on the dashboard.
2. The industry map: who makes what, who consumes what
Contrary to what many assume, memory used to be a highly fragmented industry. Through the busts, most players did not survive: Qimonda into insolvency in 2009, Elpida into bankruptcy in 2012, the Japanese and Taiwanese ranks folded, sold or shrank into niches.
What remains is one of the most consolidated commodity structures in the world, and yet, as this section shows, the demand side has changed even more than the supply side.
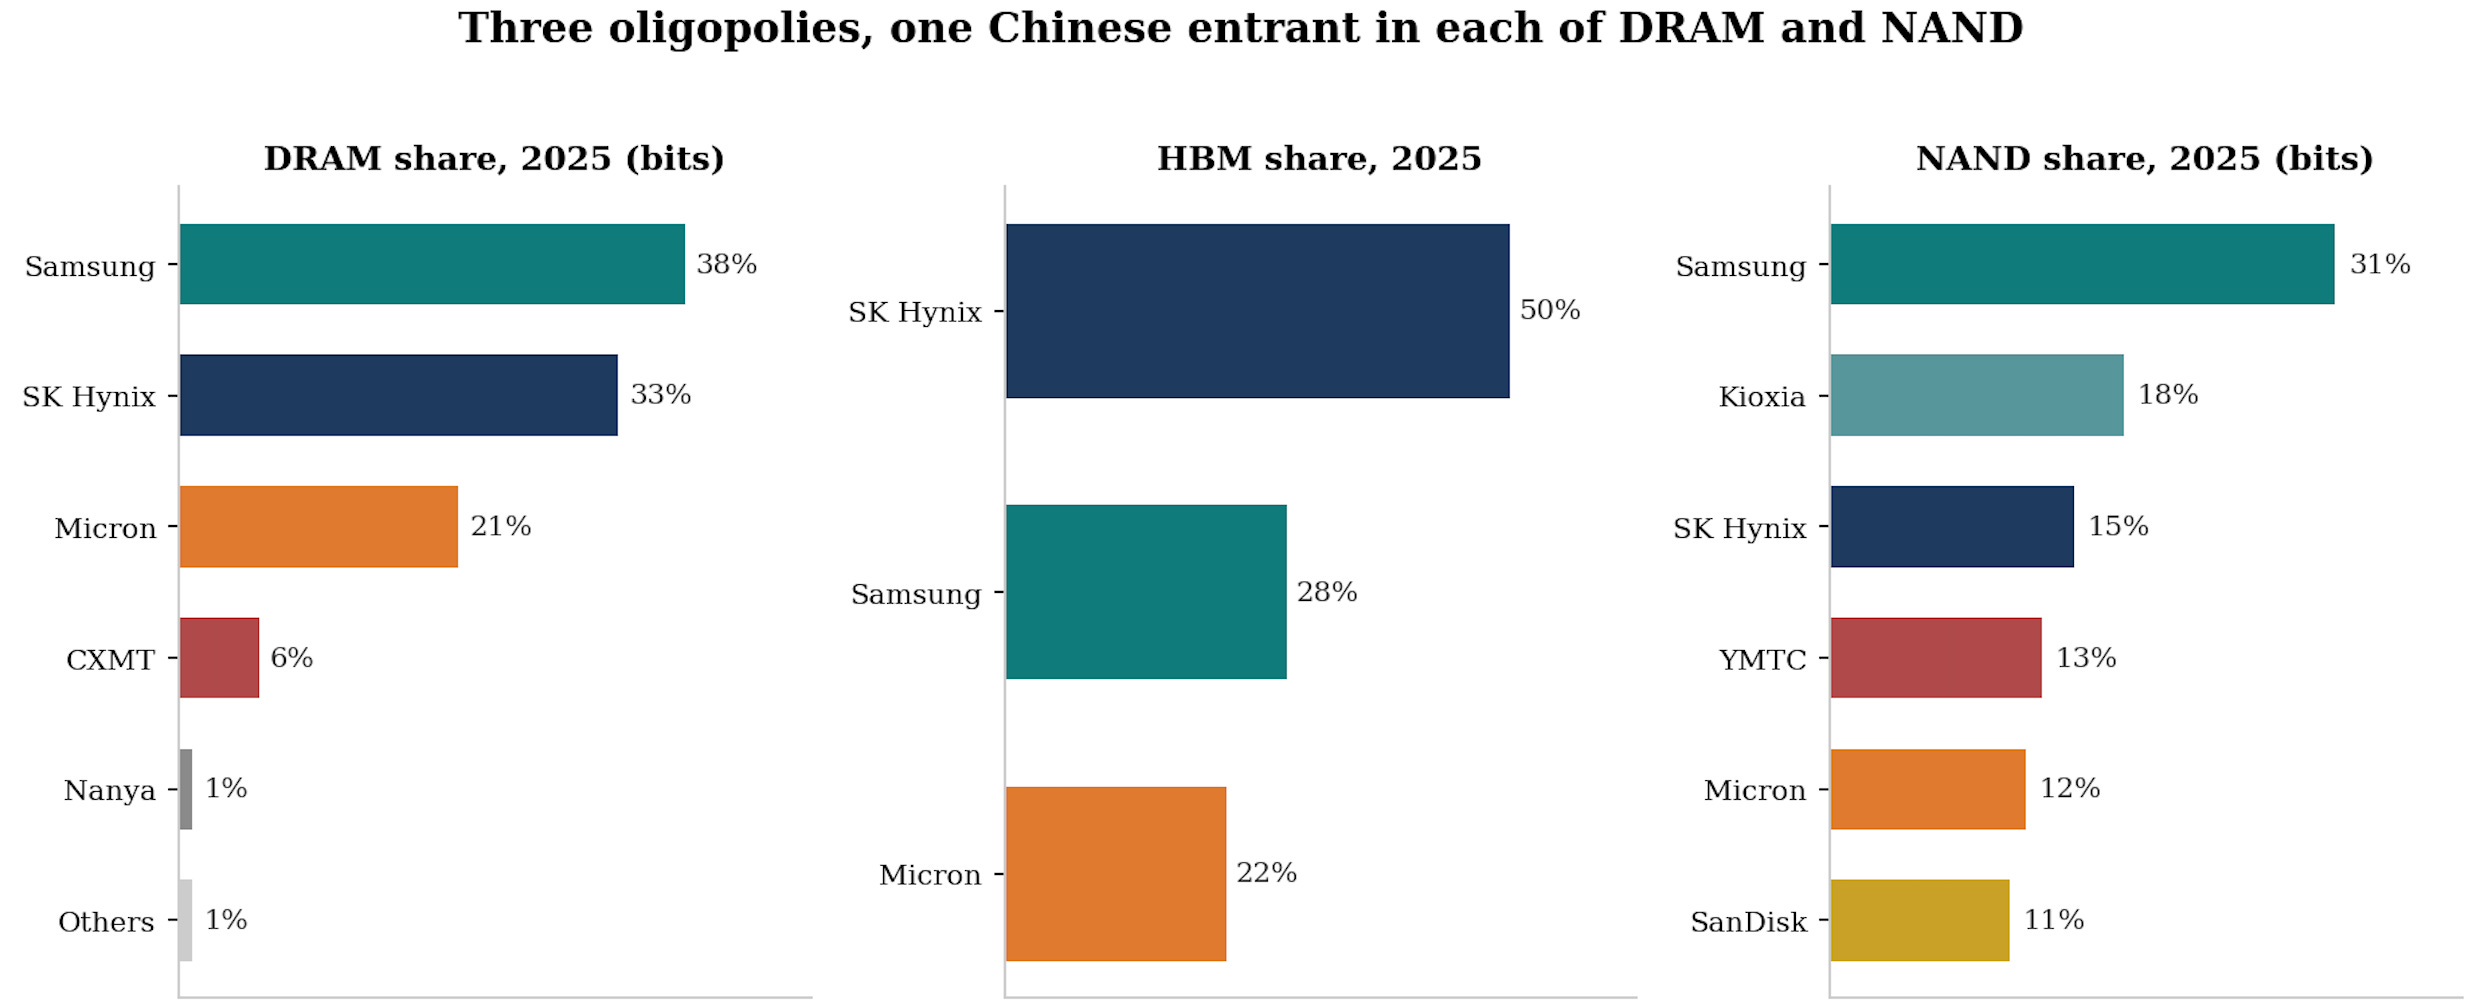
DRAM: three players and a challenger
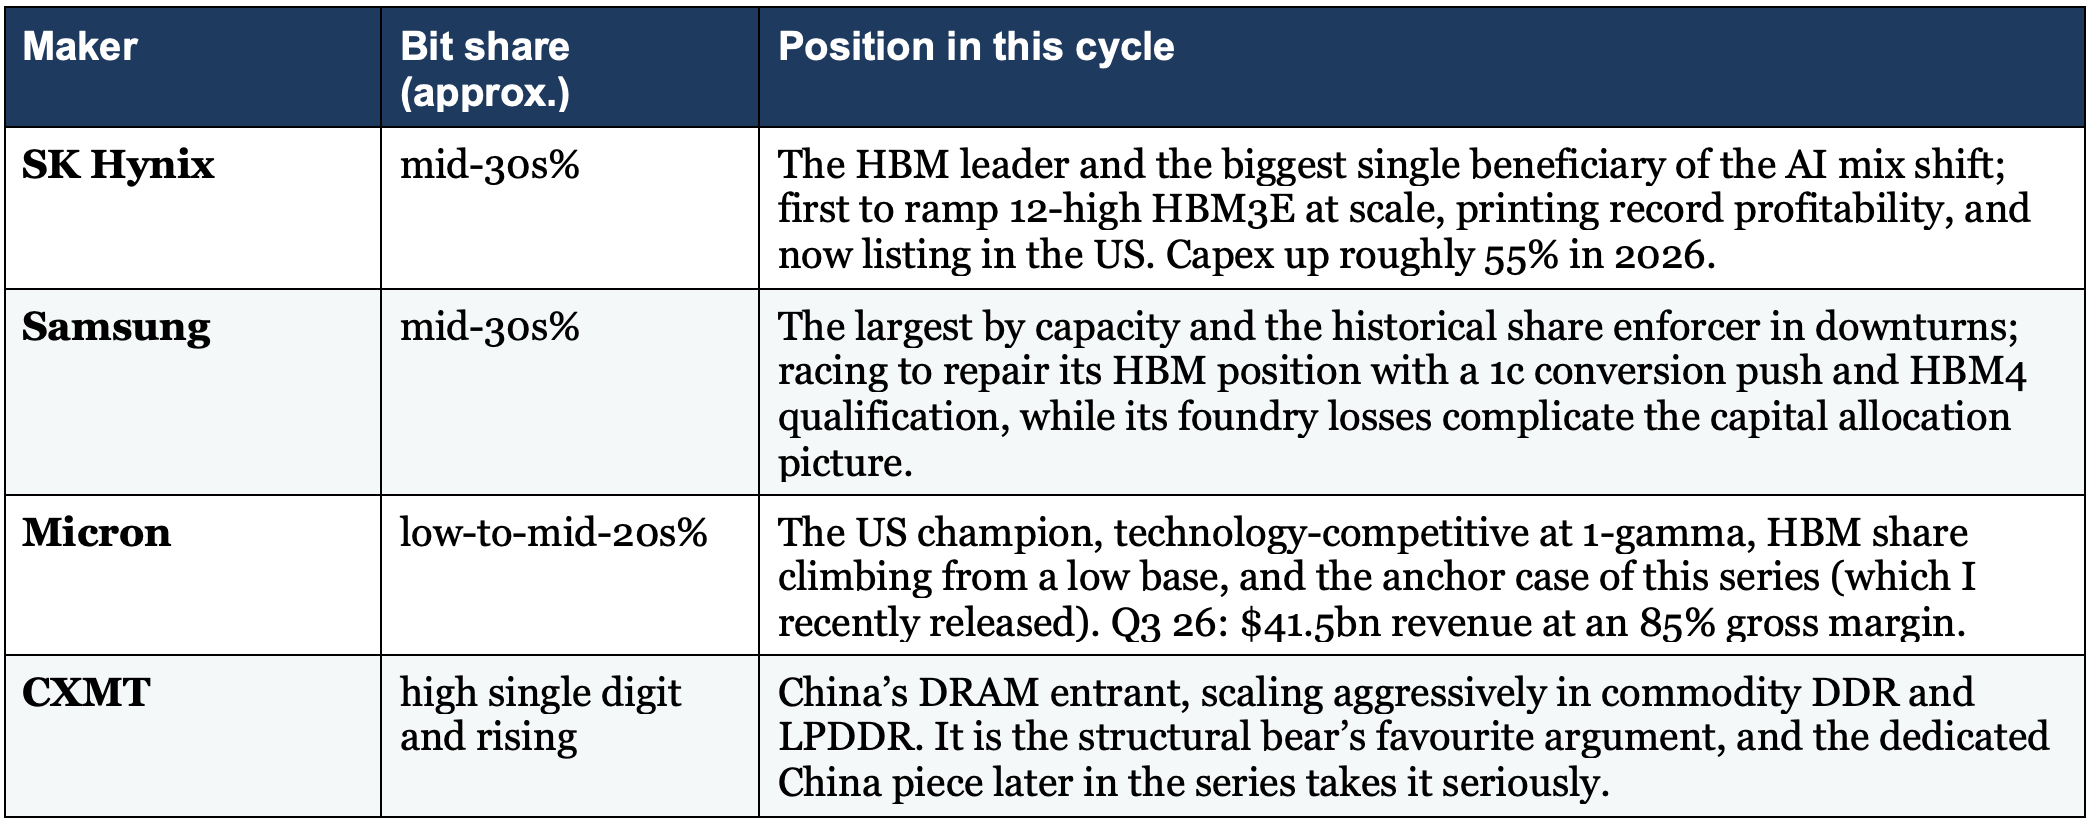
Two notes on the table:
First, revenue share and bit share have diverged: the HBM mix means SK Hynix leads on revenue while Samsung retains the largest raw capacity, a divergence that is itself the de-commoditisation thesis expressed in market-share arithmetic.
Second, the challenger matters more than its share suggests: you do not need the best product to break a commodity’s pricing, you need enough adequate product, which is why the China question gets its own debate in Section 7 and its own piece later in the series.
NAND: five clusters, tougher economics
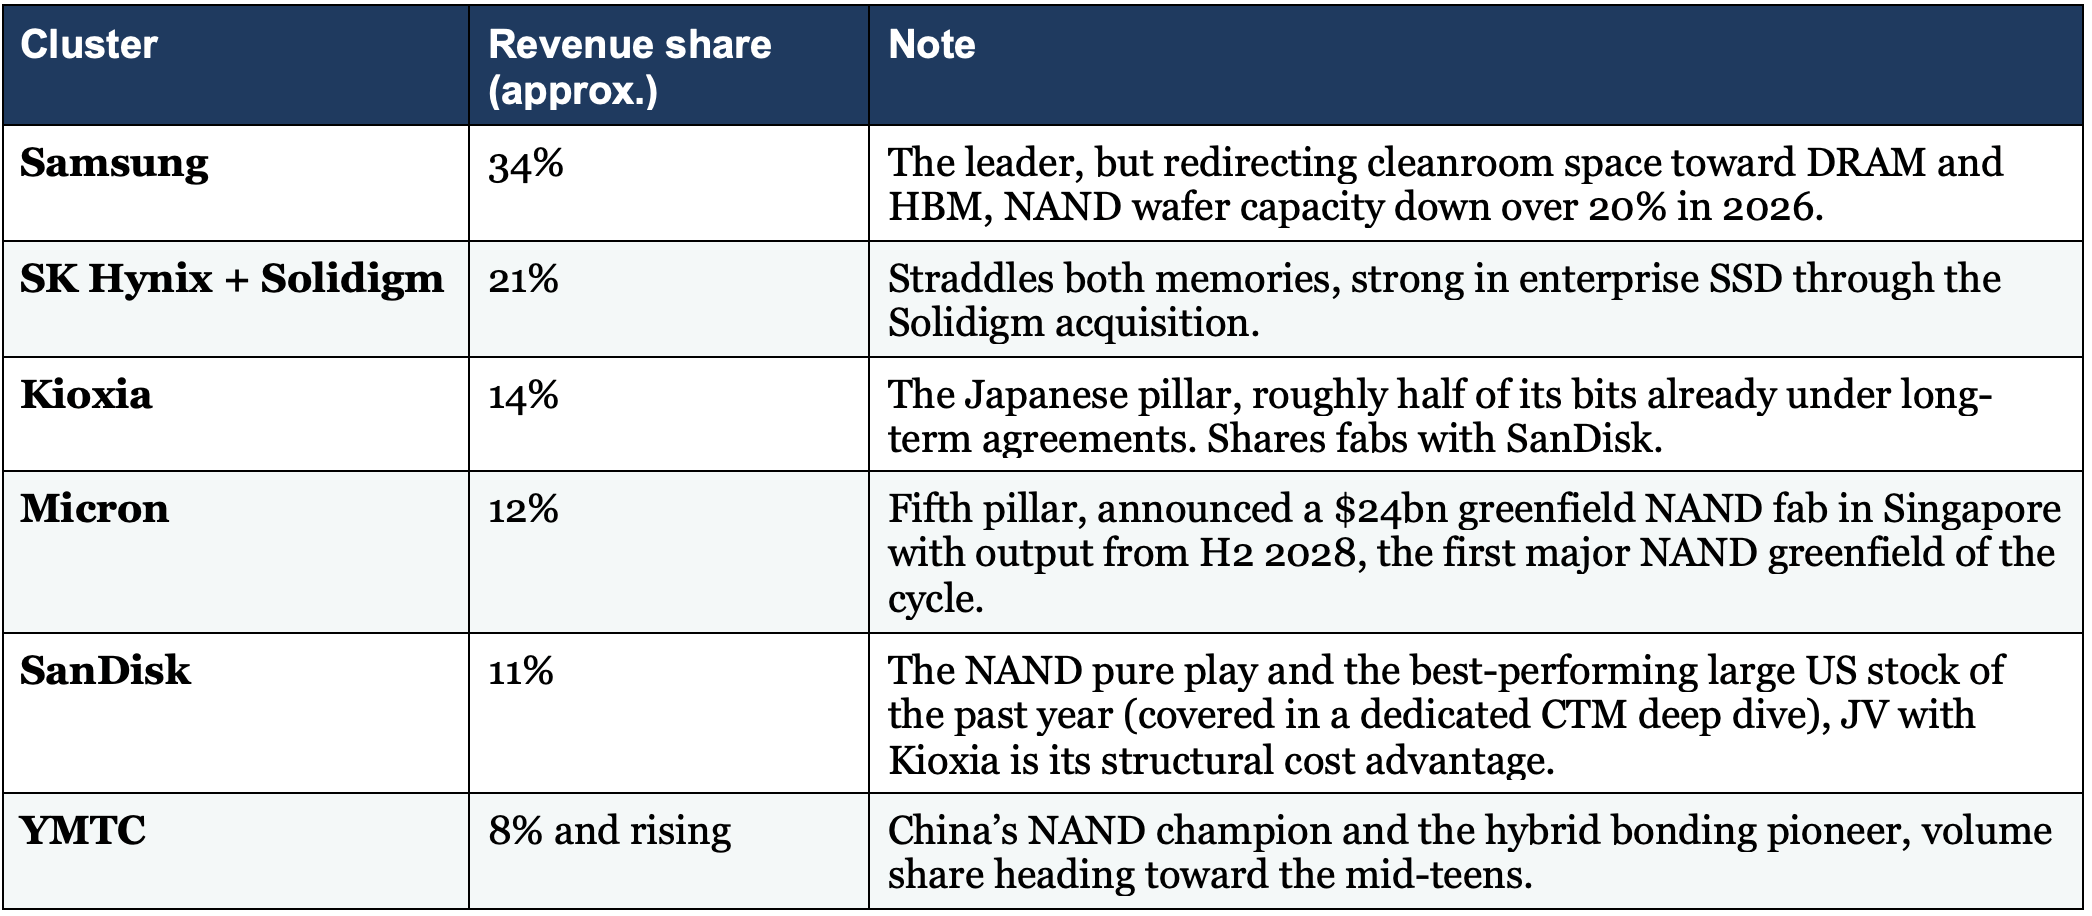
The storage layer: an effective duopoly at the bottom of the pyramid
One tier down the hierarchy sits nearline storage: high-capacity hard drives from an effective duopoly of Seagate and Western Digital, plus the enterprise SSDs that NAND makers sell into the same racks.
The hard drive industry consolidated a decade before memory did, learned contract discipline 15 years ago and runs at a capital intensity of roughly 5% of sales versus memory’s 35-plus.
Its nearline capacity is effectively sold out years ahead, the majority of its exabytes ship under long-term agreements, and the market has noticed: hard drive vendors now trade at a premium to the semiconductor index while memory makers still trade at a steep discount. Section 5 will dive into the NAND-versus-HDD question properly.
Who consumes memory: the regime change in the customer base
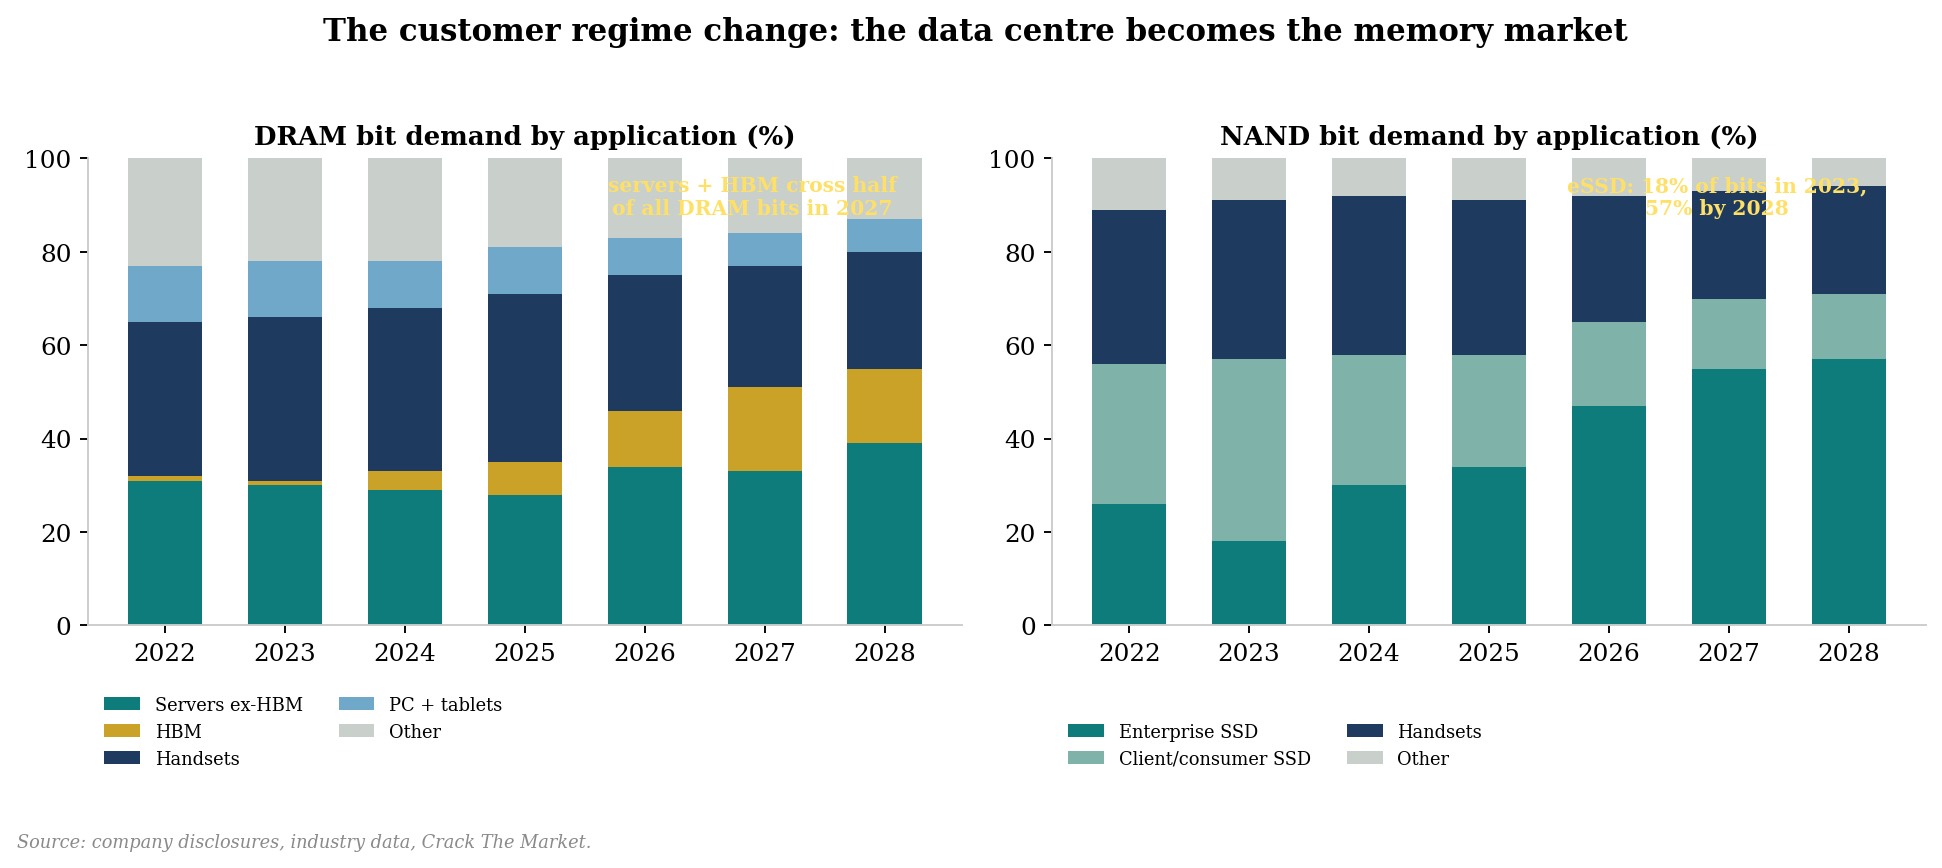
For thirty years, the marginal buyer of memory was a consumer: a PC in the 1990s, a phone after 2010. Consumer demand is inherently deflationary, every device generation must deliver more for roughly the same price, so the customer pushed price down the moment supply allowed.
That world is gone. The data center is now the largest end market for DRAM by a wide margin and will be the largest for NAND by the end of 2026, and the marginal buyer is a hyperscaler whose constraint is availability, not price.
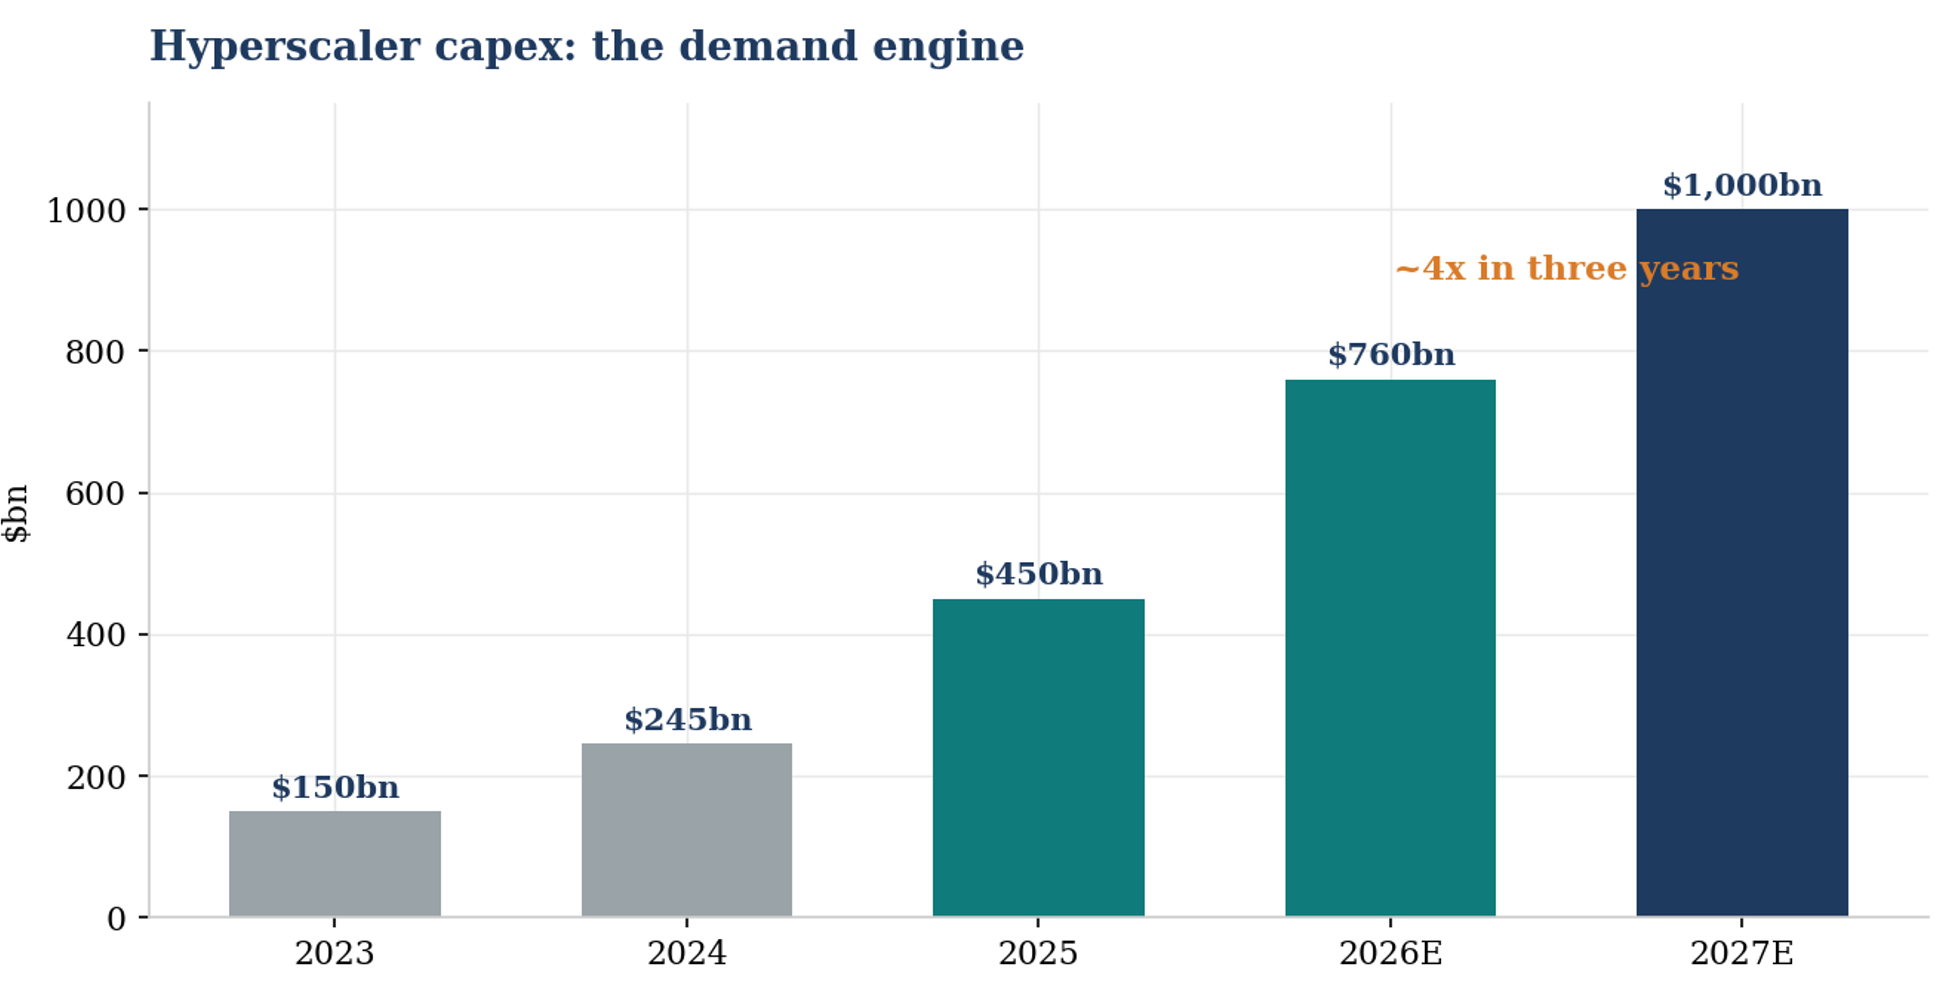
Hyperscaler capex roughly quadruples in three years: from $245bn in 2024 to $450bn in 2025, above $760bn in 2026 and toward $1tn in 2027.
Inside that capex, memory’s share is exploding. Industry estimates put memory at under 8% of hyperscaler capex in 2023 and 2024, 13.5% in 2025, roughly 30-35% in 2026 and approaching half by 2027, as HBM content per accelerator ramps and server DRAM and enterprise SSD prices reset higher.
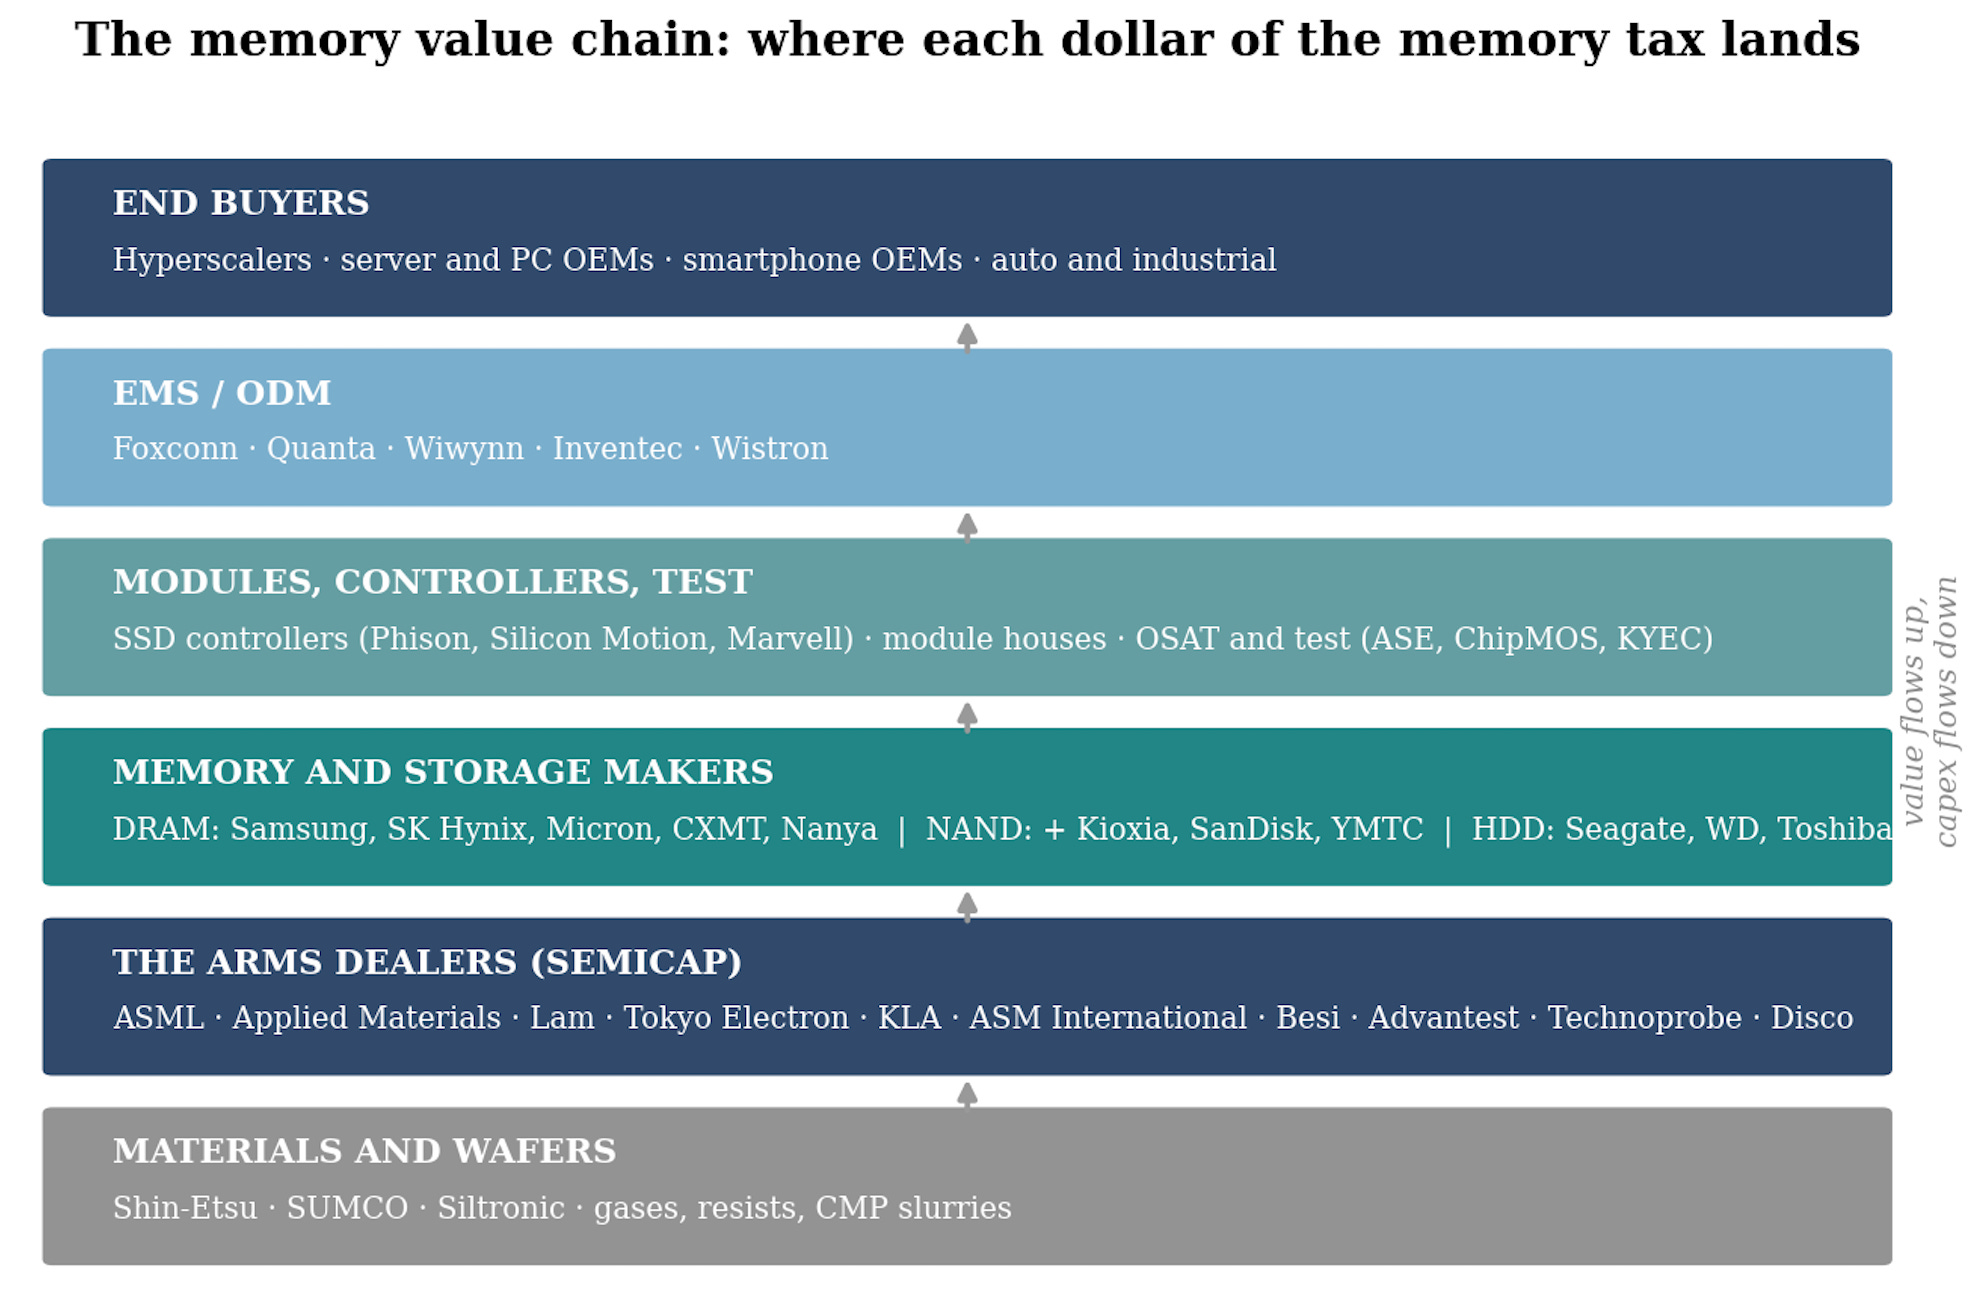
The buyers themselves have started calling it the memory tax.
This is by very far what has shocked me the most when researching this primer. Hyperscalers will soon be spending half of their hundreds of billions in capex on memory! This explains why memory makers are now worth trillions.
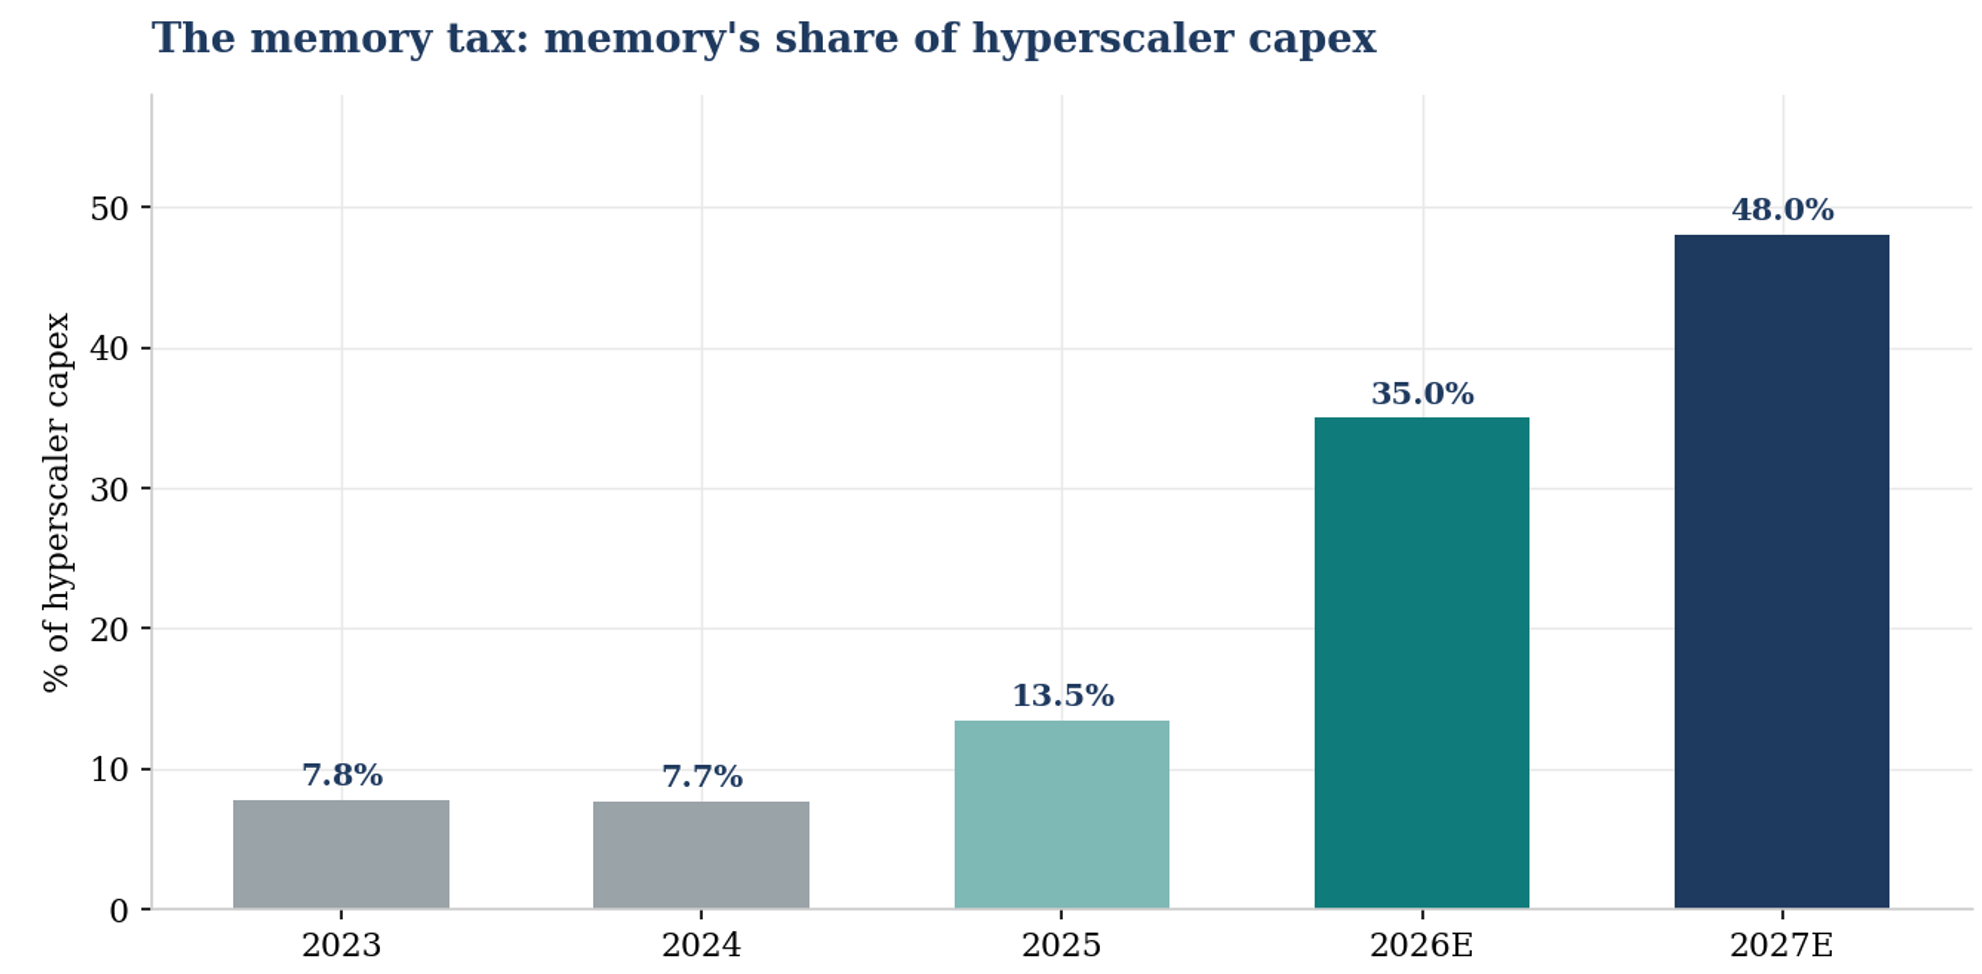
The memory tax: memory’s share of hyperscaler capex, from a rounding error to potentially the largest single line item. Memory content embedded in what hyperscalers capitalize, with HBM flowing through accelerator prices and server DRAM, eSSD and HDD purchased directly.
The per-unit arithmetic is just as striking:
HBM capacity per accelerator climbs from 141GB on the H200 generation to 288GB on current 12-high parts, 768GB on the 16-high HBM4E generation and toward 1TB per accelerator on the next AMD flagship, a roughly sevenfold ramp across one roadmap, before counting unit growth.
And the surprise of the past year is the broadening beyond the GPU: agentic AI workloads need CPUs to orchestrate them, the GPU-to-CPU ratio in the installed base is inverting from over 5-to-1 toward roughly 2.4-to-1 by 2028 (something I covered in my CPUs are the next GPUs deep dive), and every incremental AI-grade CPU drags a large helping of conventional server DRAM with it. Server DDR demand alone is forecast around 145bn gigabits in 2027.
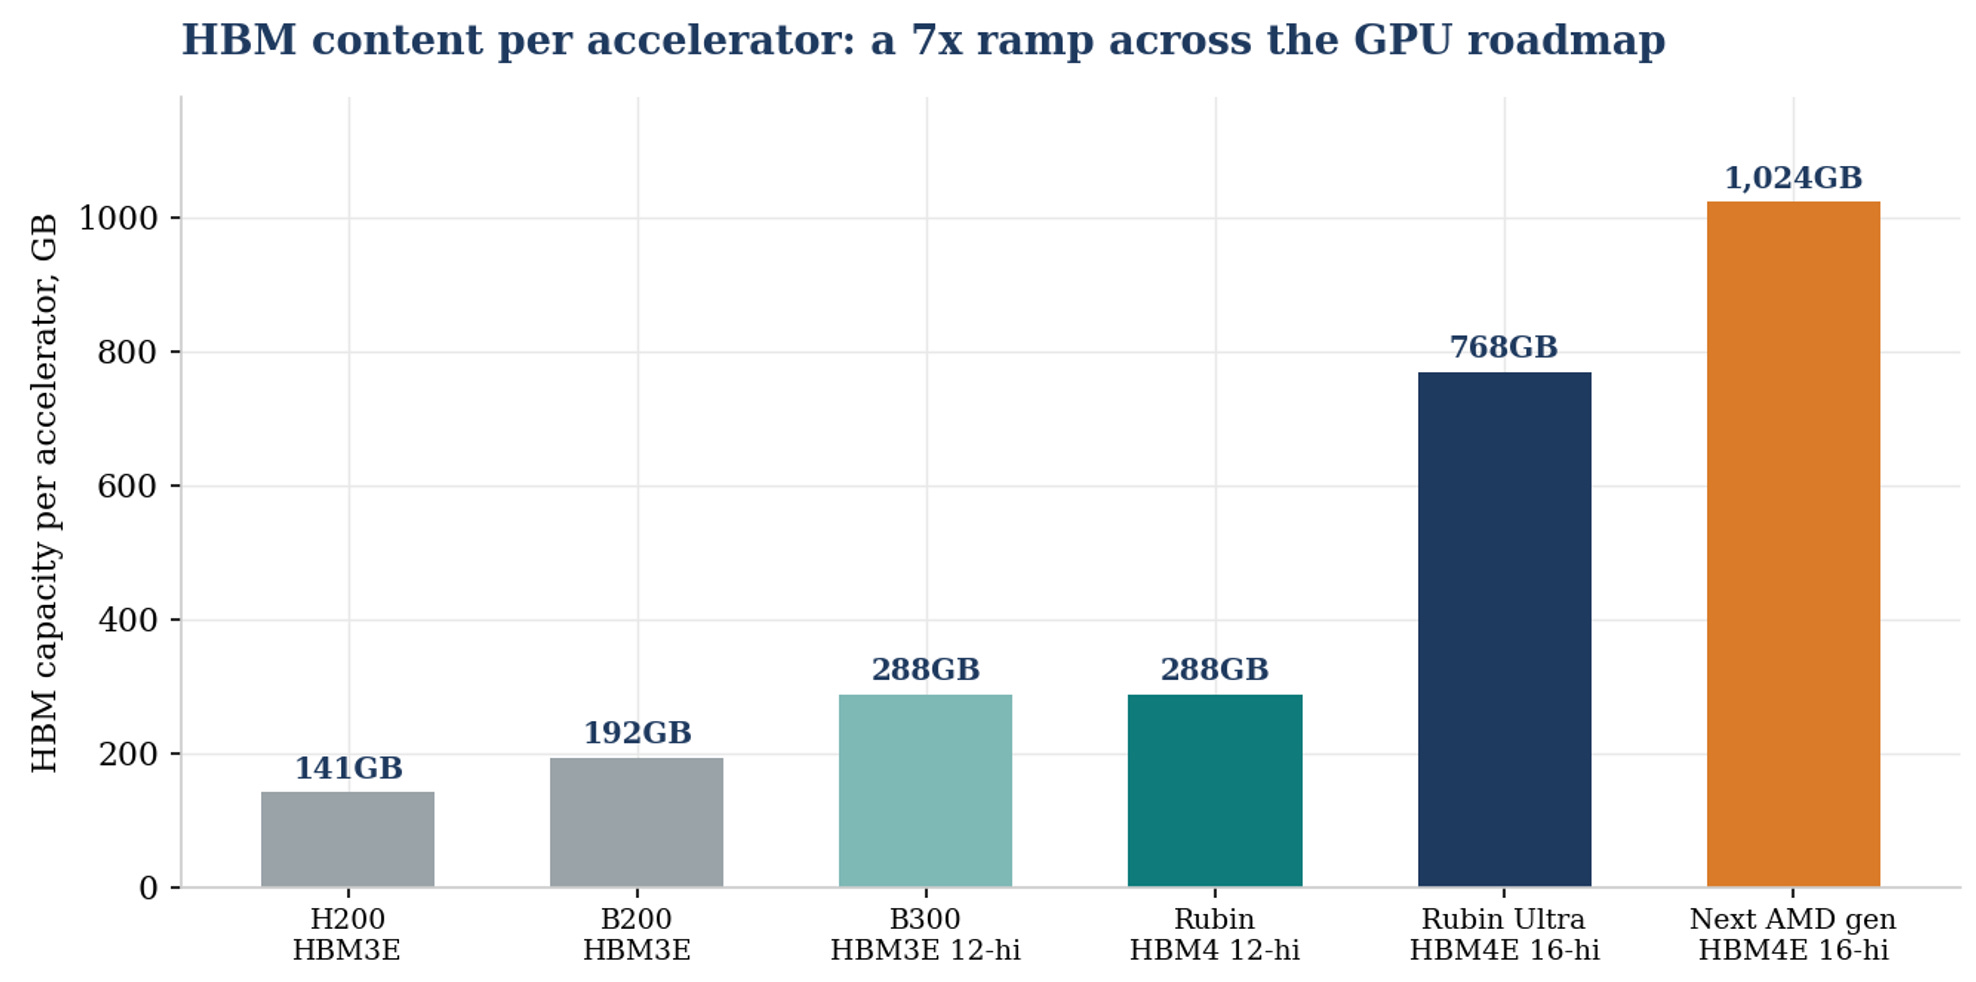
HBM content per accelerator across the roadmap. The memory content ramp is steeper than the unit ramp.
Meanwhile the old consumer segments have become price-takers on the wrong side of the squeeze: smartphone and PC makers are flagging memory cost increases approaching 100%, trimming volume forecasts and de-speccing storage configurations.
Who consumes memory has flipped from the price-setter to the residual claimant, and that reversal, more than any single technology, is what people mean when they say this cycle is different.
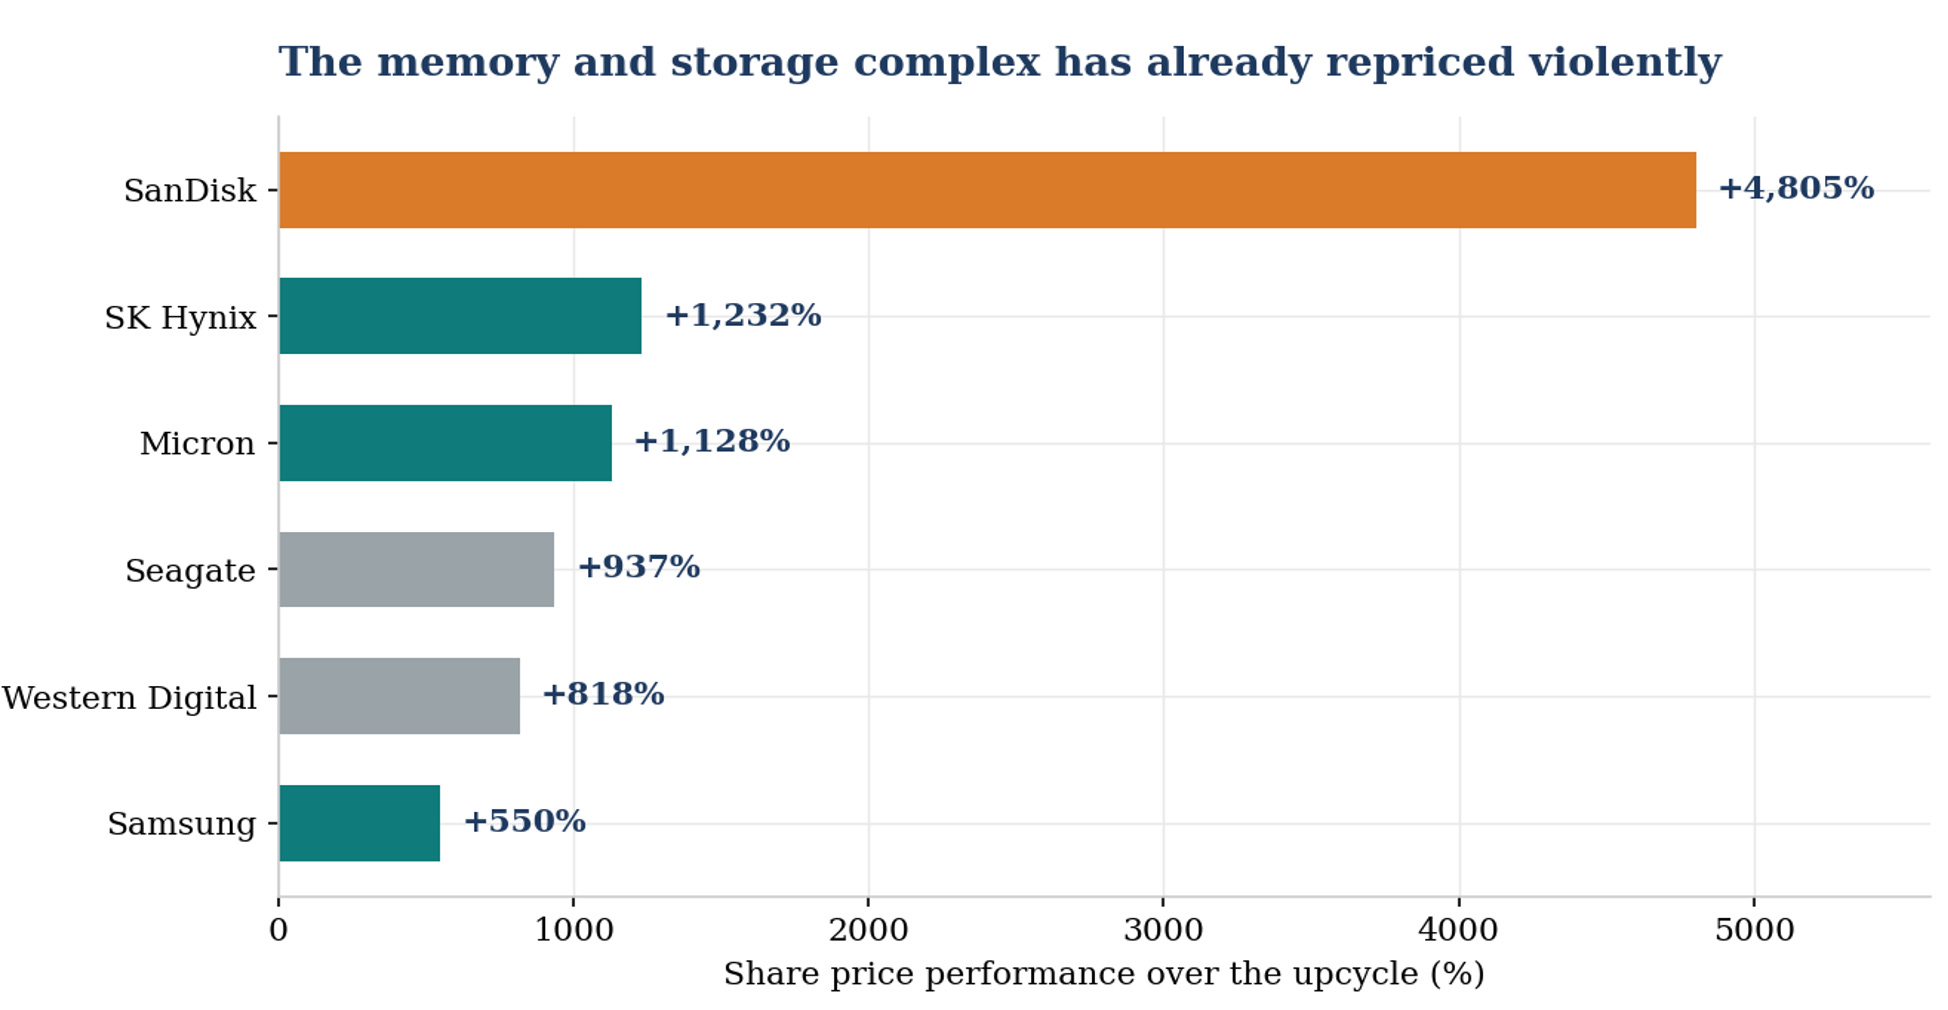
The complex has repriced violently: memory makers (teal), the NAND pure play (orange) and the hard drive duopoly (grey) over the upcycle.
3. The supercycle: demand, supply, and the capacity response
Why AI is uniquely memory-hungry
Every prior compute cycle used memory. What is different about AI is the slope of the demand curve, and it comes from five places at once:
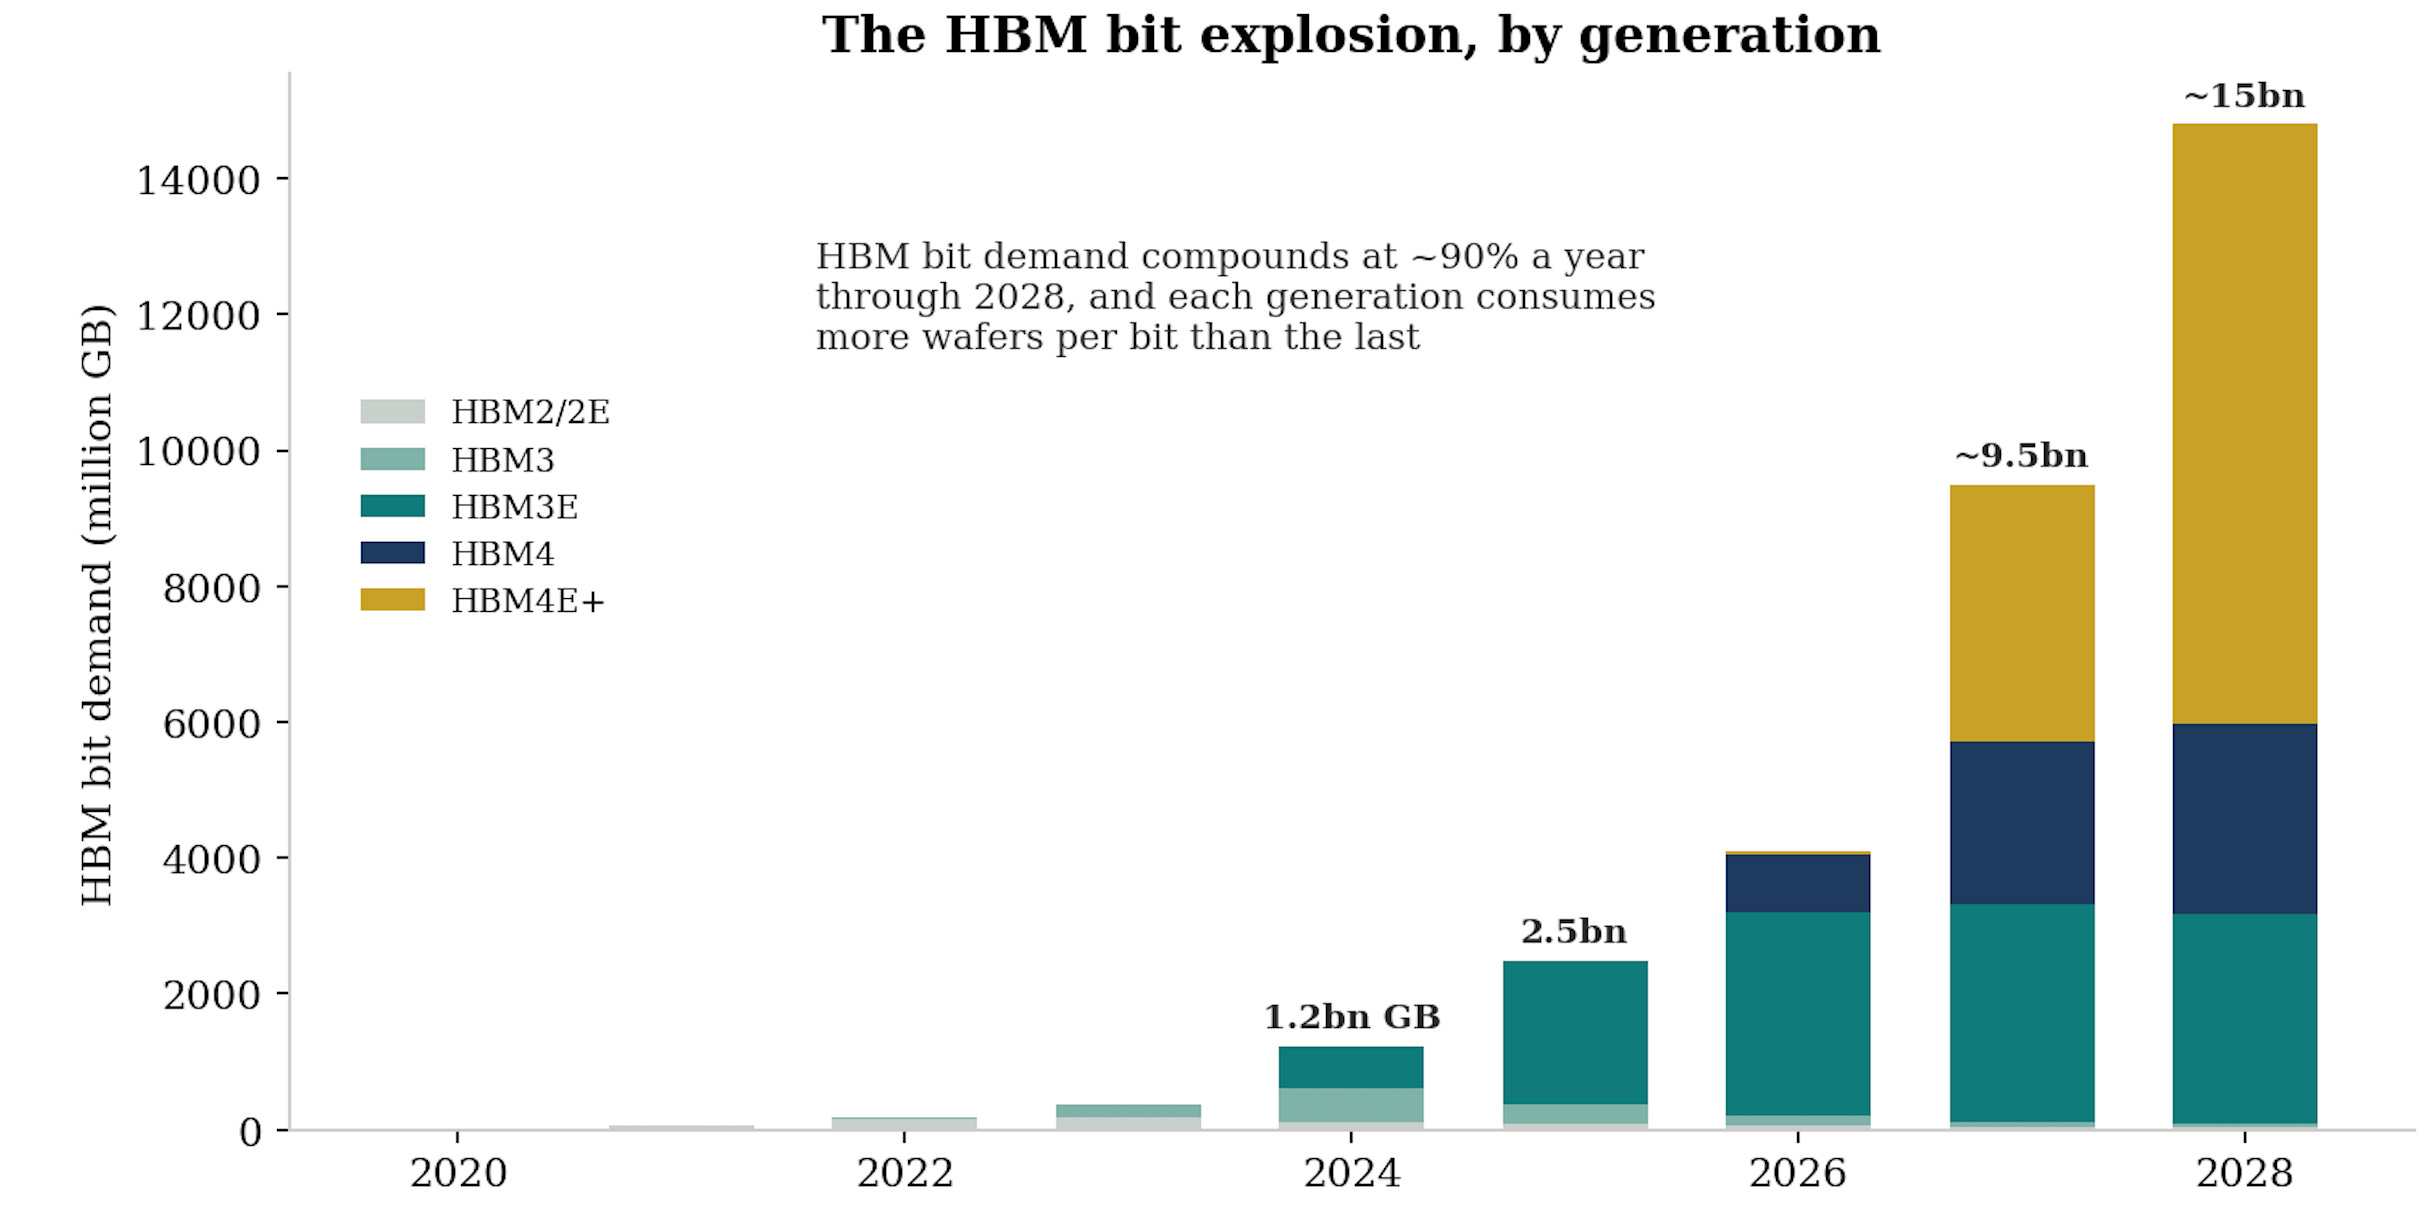
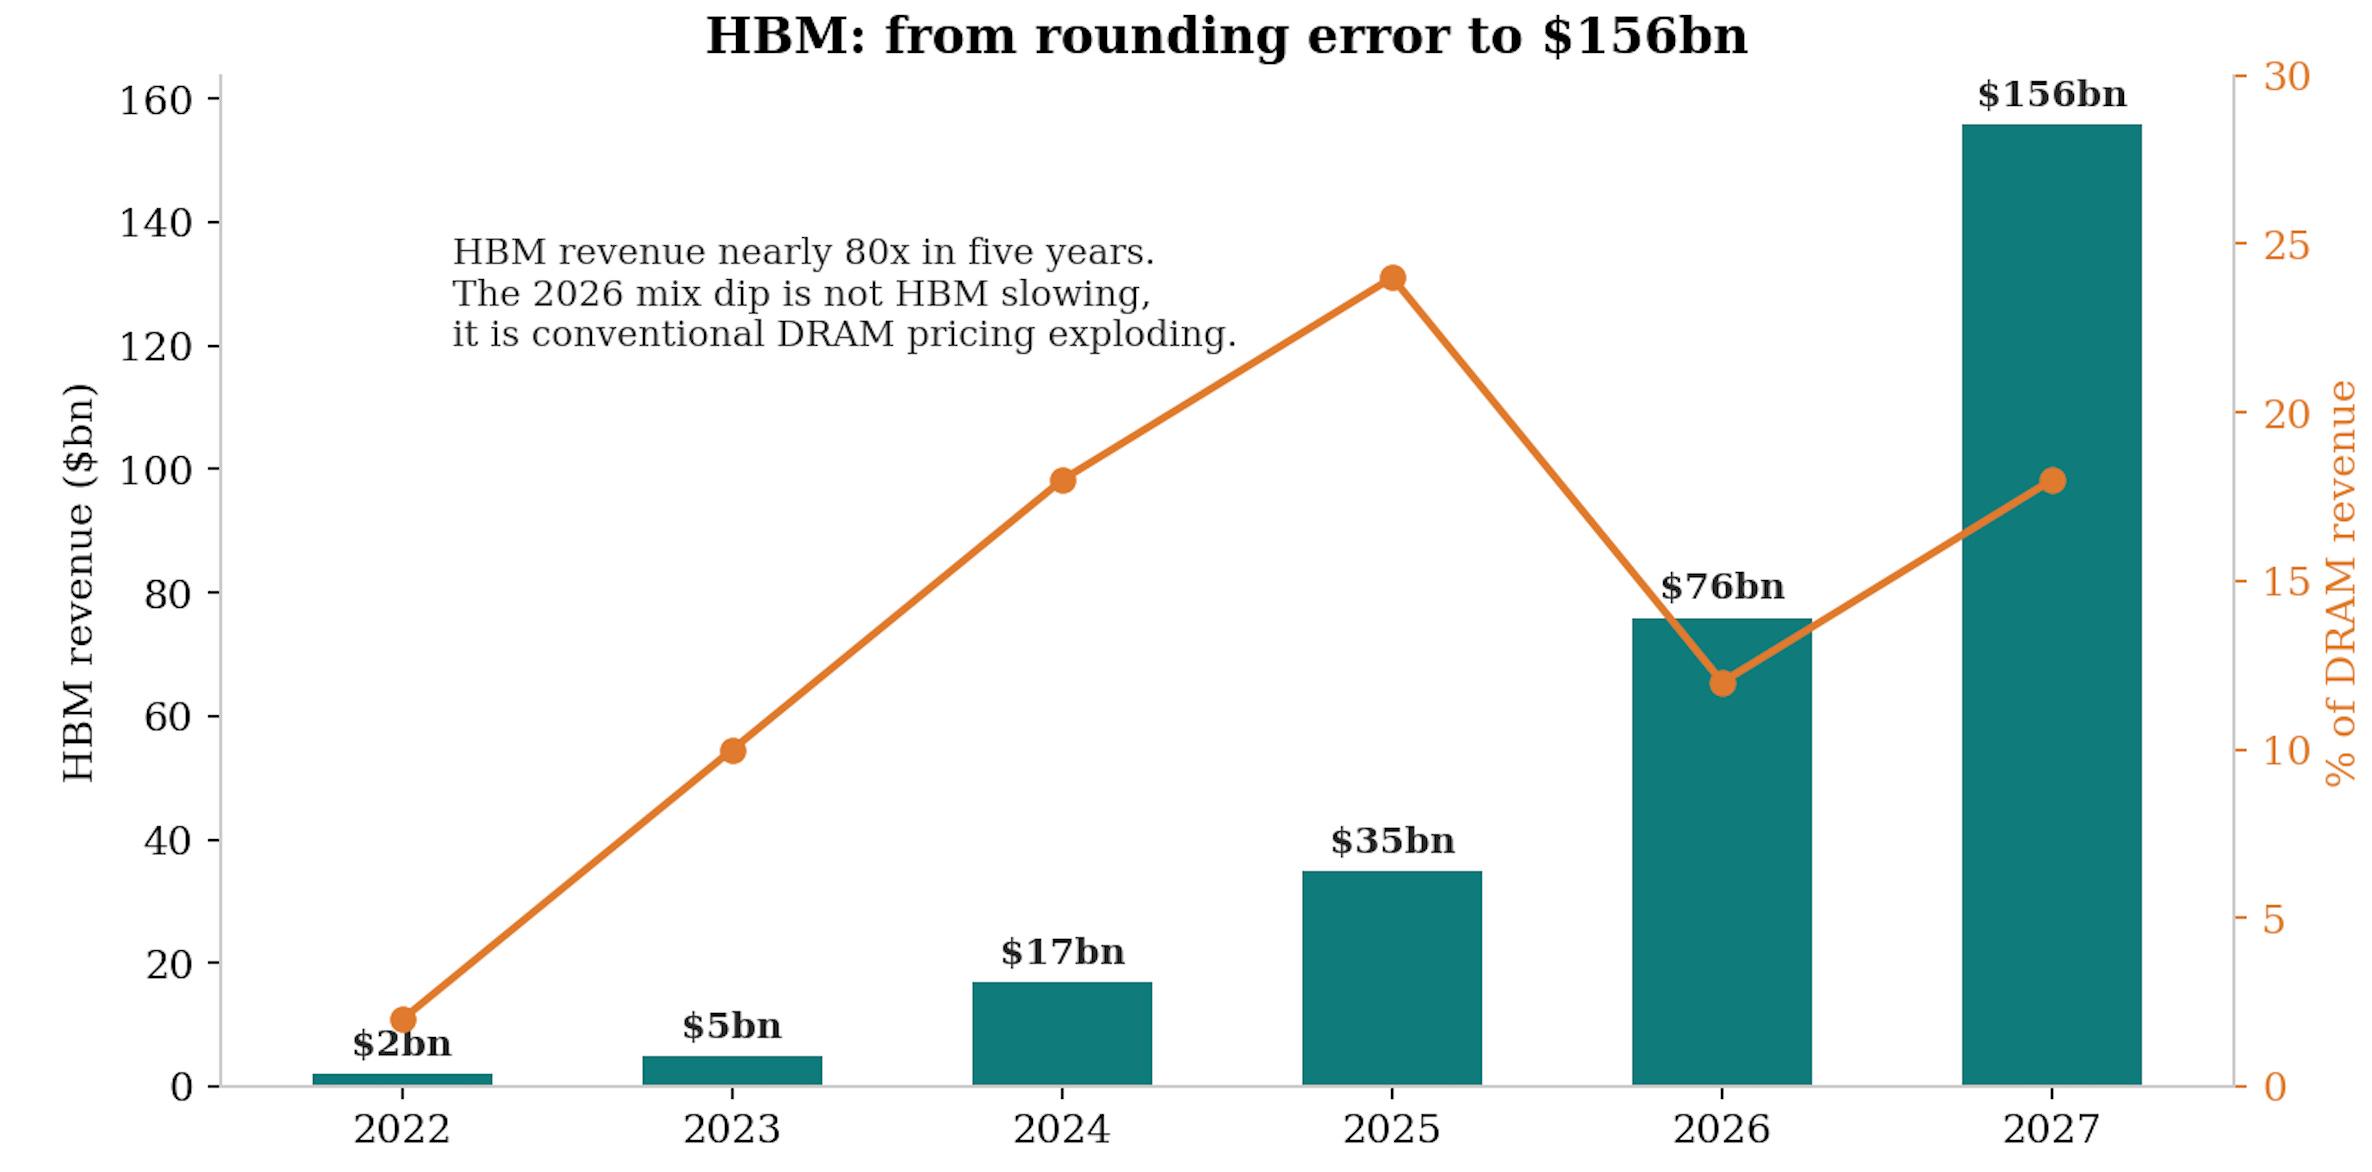
Training chews through enormous datasets and requires raw bandwidth, it is what made HBM the spearhead, with HBM bit demand compounding at roughly 90% a year through 2028 on industry estimates, far above the rest of the market.
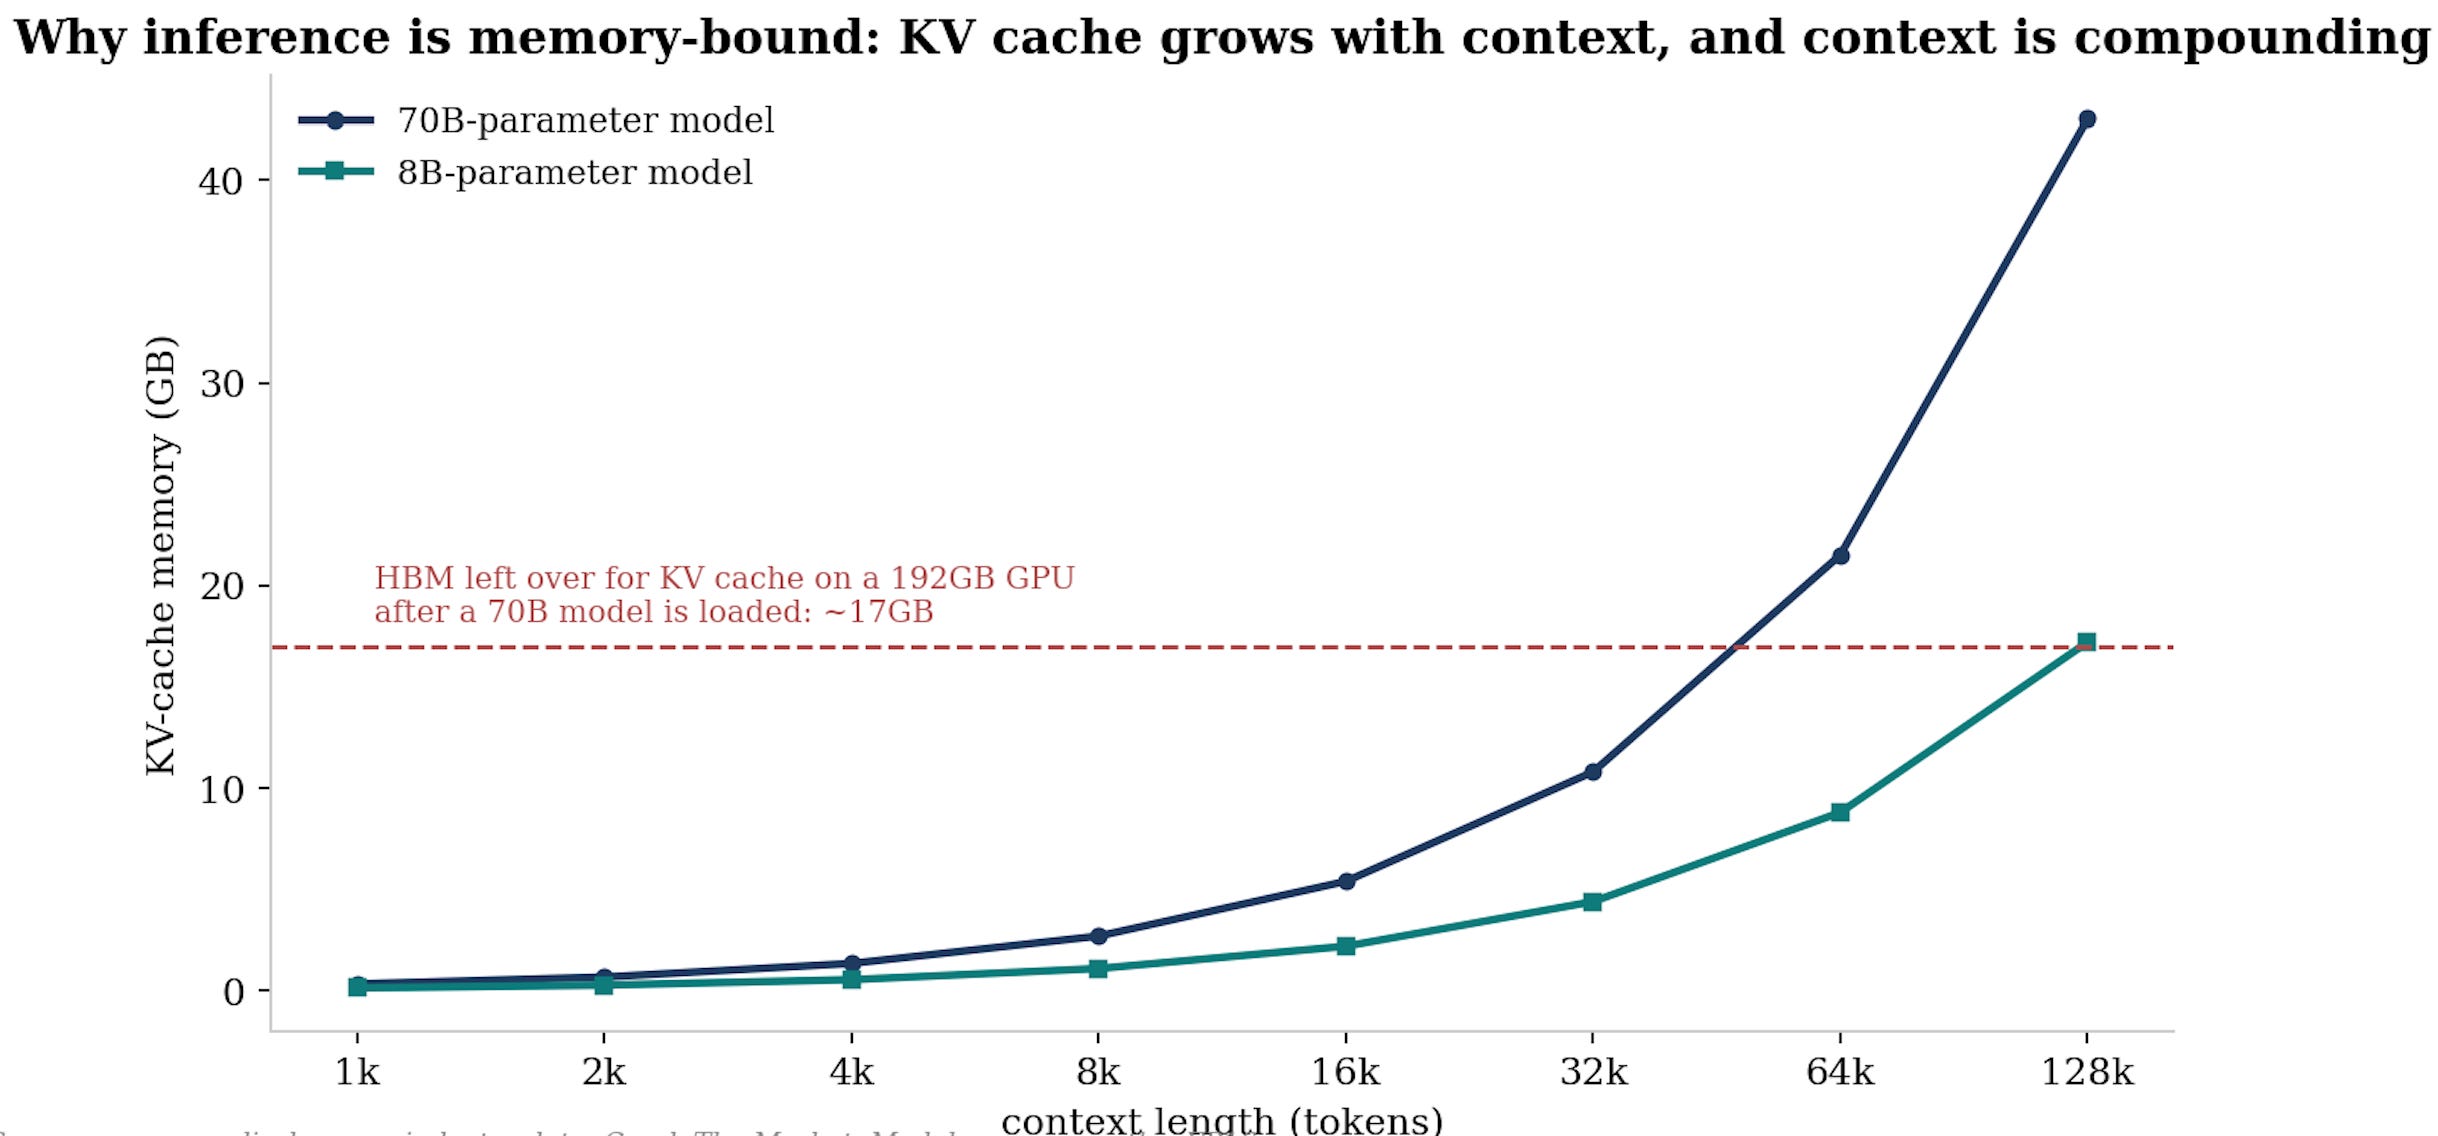
Inference is memory-bound, not compute-bound. Latency depends on how fast weights, keys, values and activations move from memory to the processor, not on arithmetic speed. The working memory of inference, the KV cache, grows linearly with context windows, and context windows are expanding roughly 30x per year. Rising concurrency (models serving many users at once) multiplies it again. This is the single most durable pillar of the demand case, because inference, unlike training, scales with usage and revenue.
Agents are, structurally, memory amplification machines. A useful agent must remember the conversation, the task state and the world across long horizons, statelessness is uselessness. As agentic workloads grow, they pull on every tier of the hierarchy simultaneously.
The CPU broadening: the orchestration layer around the models needs conventional servers, and with them conventional DRAM, a genuinely new leg of demand that was not in the original thesis.
Storage: model checkpoints, training corpora and the exhaust of inference land on enterprise SSDs and nearline drives, the enterprise SSD market is on track to more than double over two years, and new accelerator architectures are being designed with large NAND pools attached, which alone could add 75 to 100 exabytes of demand in 2027 and nearly double that in 2028.
My view: The pattern to internalise is that every time the market thinks it has sized the demand, another adjacent workload starts pulling on memory. The thesis began as “HBM feeds GPUs”. It is now HBM plus server DDR plus LPDDR in accelerators plus enterprise SSD plus nearline drives. Demand breadth, not demand size, is what makes this cycle structurally different from 2017 or 2021, because five uncorrelated demand engines do not roll over on the same quarter.
What the numbers already show
This is no longer a forecast argument, the prints are in and they keep shocking investors:
The best exhibit is Micron’s Q3 26 reasults (May 2026 quarter), reported last week: revenue of $41.5bn against guidance of $33.5bn, a gross margin of roughly 85%, record free cash flow of $18.3bn in the quarter, and a net cash balance of $24.4bn.
Guidance for FQ4 is more remarkable still: revenue of $50bn, up 21% sequentially, at a record 86% gross margin, which is software-grade profitability from a company that was writing down inventory three years ago.
Management disclosed 16 Strategic Customer Agreements signed across data center, consumer and automotive, and HBM is sold out for the whole of calendar 2026 with multi-year agreements in negotiation beyond it.
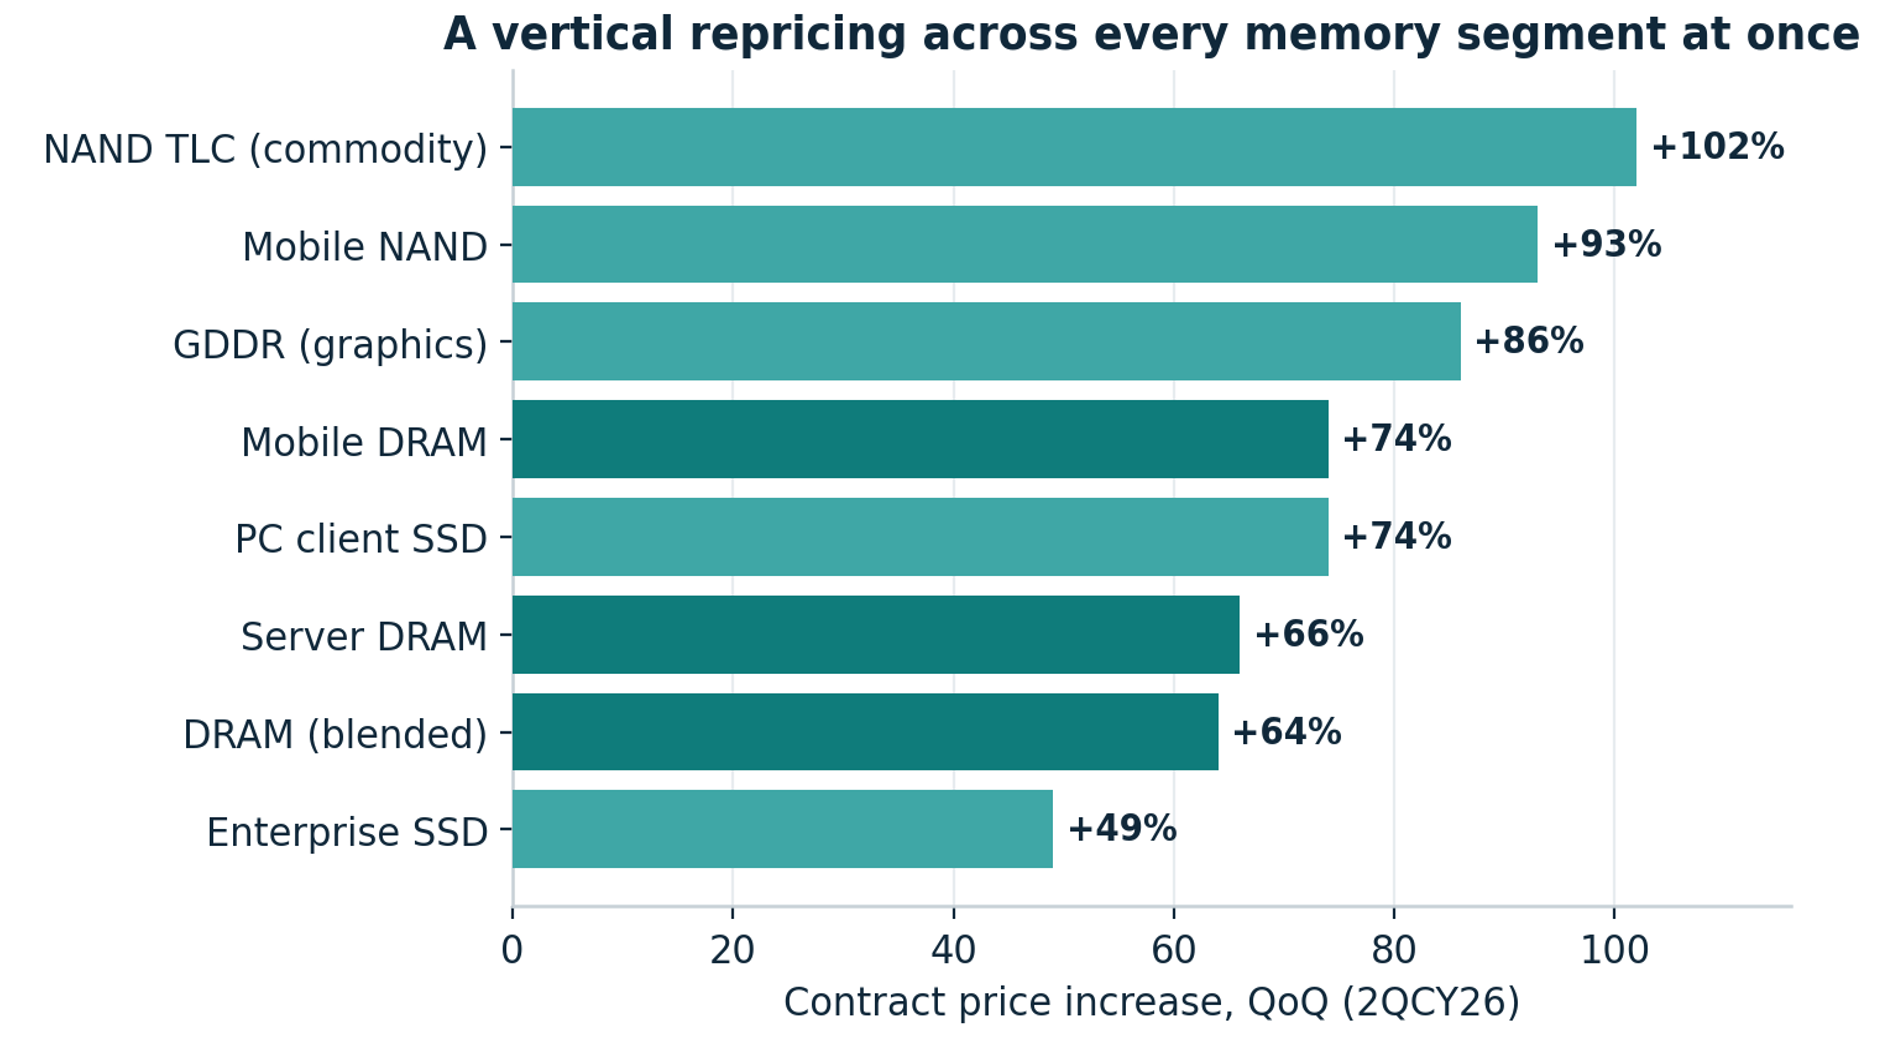
Pricing corroborates everywhere you look:
DRAM contract prices have roughly tripled over a year.
Blended HBM pricing is forecast up a further 66% in 2027 as HBM4 lands around $3 per gigabit and HBM4E closer to $3.5, versus server DDR5 near $2.
NAND has followed with a lag: enterprise flash pricing stepped from roughly $180 per TB to over $320 in three quarters before beginning to plateau.
The consumer market, as ever, pays the residual: standard DDR spot spiked more than 7x from late 2025 as wafers migrated to HBM. This is why all of your electronics are about to become a lot more expensive.
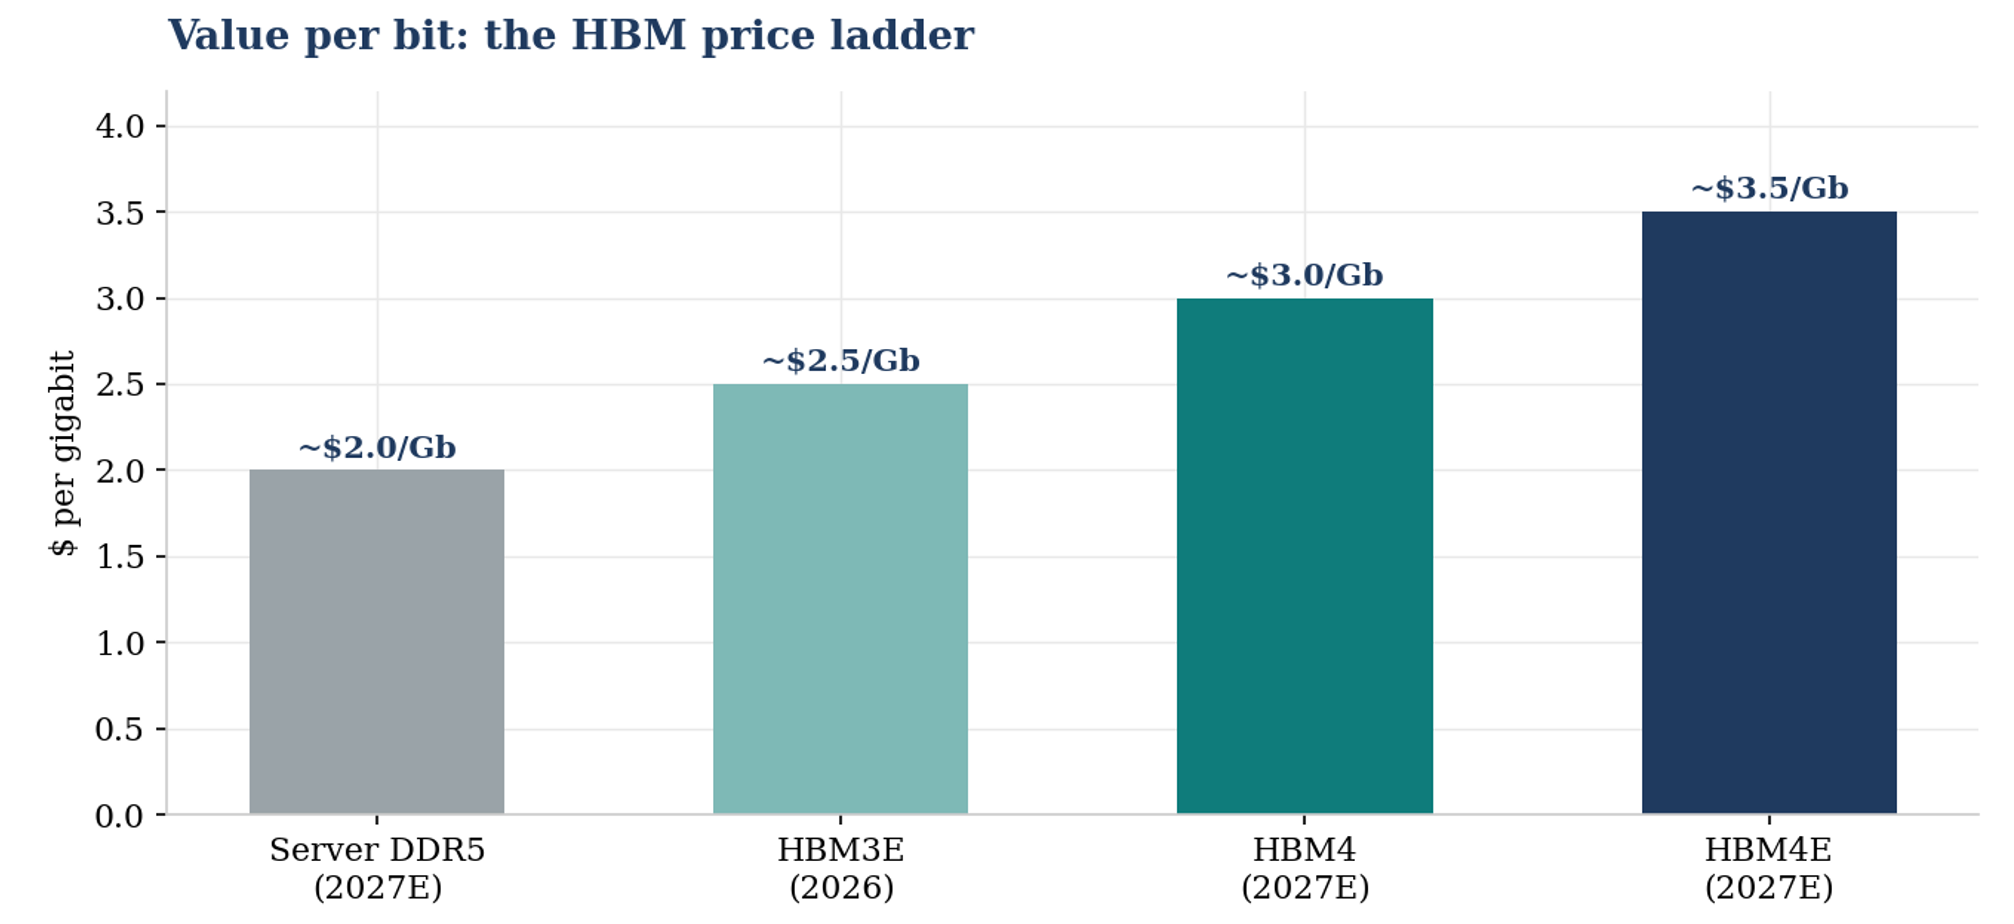
Value per bit: HBM4E commands roughly 75% more per gigabit than server DDR5, on a product that consumes over 3x the wafers.
Why supply cannot respond quickly
The supply side has behaved differently this cycle, and it pays to be precise about why.
Part of it is genuine discipline: the 2022-23 bust, with billion-dollar losses across the board, happened only two years before the AI wave arrived, so this upcycle hit an industry still nursing its scars rather than one drunk on its own success. But a larger part is simple physics and simple arithmetic:
There has been essentially no expansion of memory cleanroom space since 2022. A new fab shell takes two to three years to construct, the specialised equipment inside it has delivery lead times north of twelve months, and the equipment makers have their own bottlenecks, EUV lithography being the tightest but the whole semicap ecosystem has visibility two years out and is largely booked short term (also due to the ultra strong logic/foundry demand also linked to AI). Even if all three players decided today to double output, they would have to build the buildings first, then wait for the machines.
The trade ratio converts demand growth into supply shrinkage. Every wafer redirected from DDR5 to HBM removes roughly three wafers’ worth of commodity bits from the market. HBM demand growth therefore tightens the conventional market automatically, which is precisely the mechanism that broke standard DDR pricing in late 2025.
NAND capacity is actually falling: industry wafer capacity is down about 2% in 2026, with the leader cutting NAND cleanroom allocation by over 20% to feed DRAM and HBM, even as NAND bit output grows roughly 20% through node migration and layer stacking.
Put demand and supply together and the industry models converge on the same shape: the DRAM market does not find genuine equilibrium before roughly 2028-29, with the deficit at its widest through 2027.
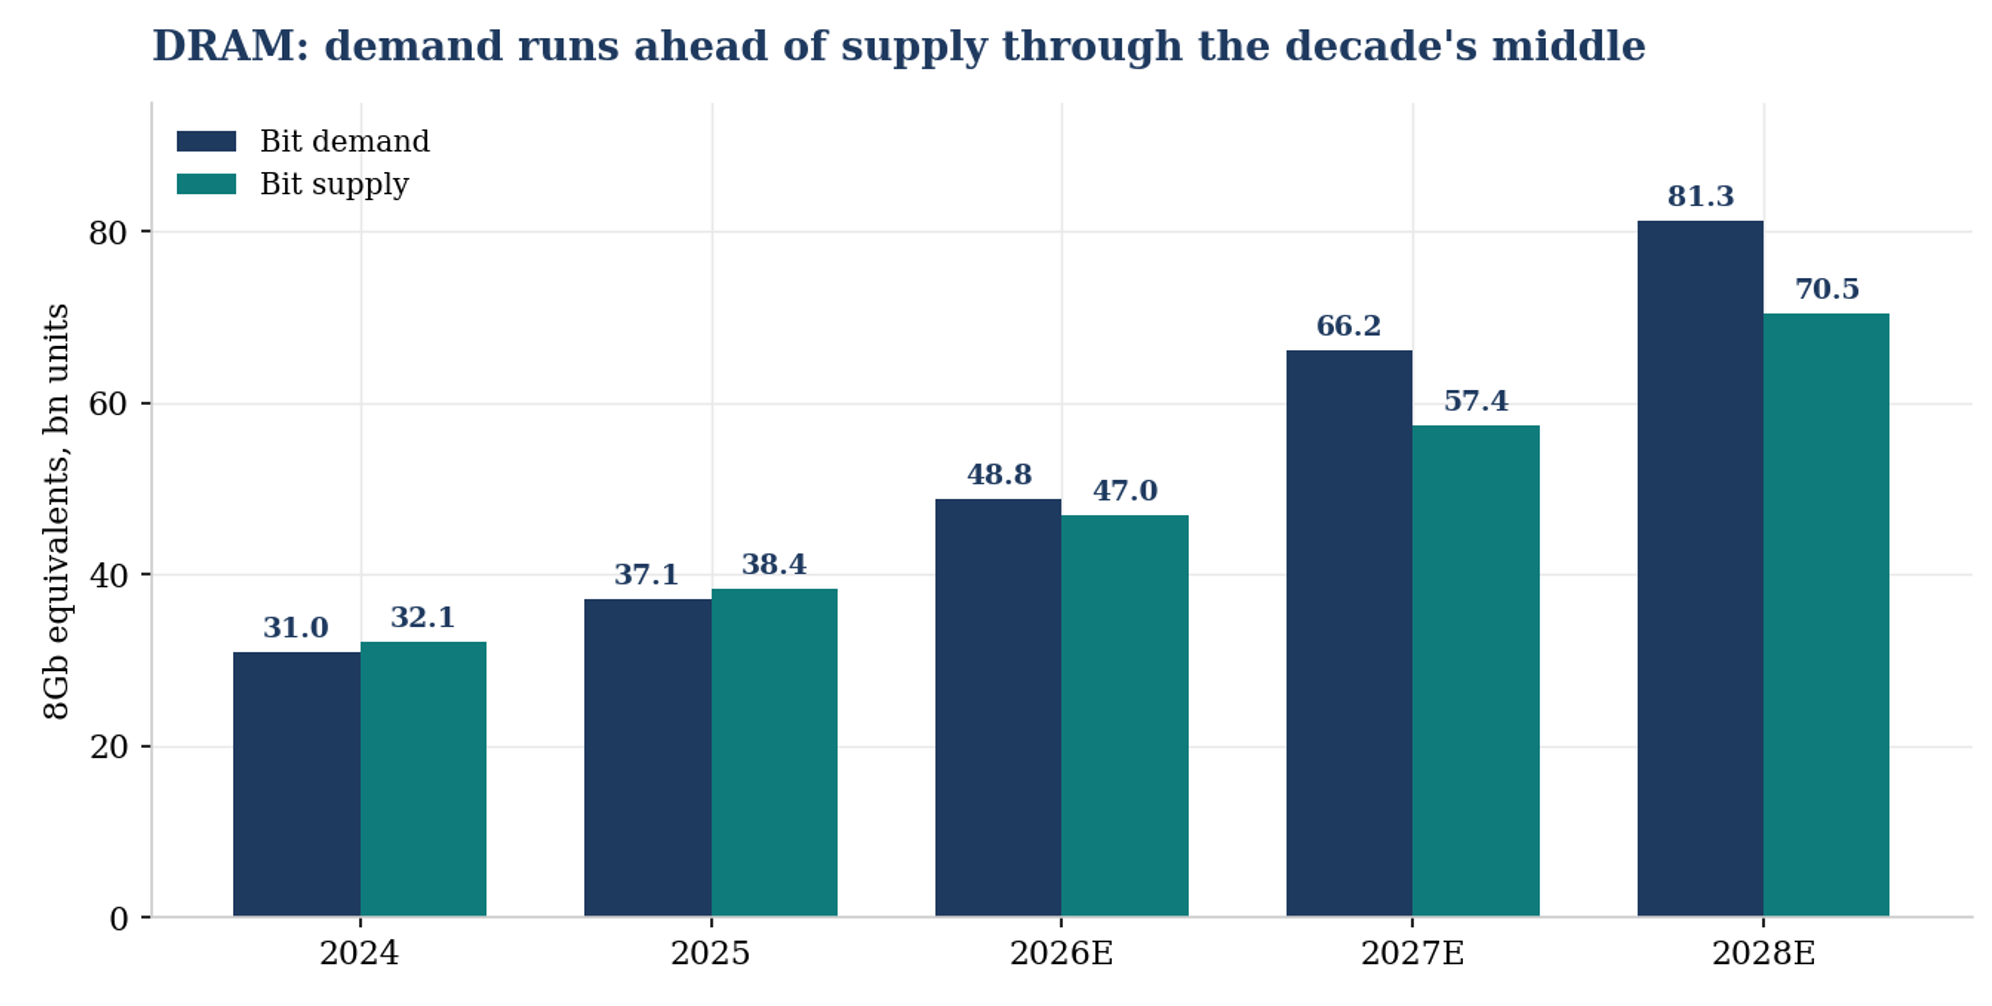
DRAM bit demand versus supply: a deficit that widens into 2027 and only begins to close as the 2027-28 greenfield wave lands.
The capacity ledger: every announcement that matters
The response is now underway, and it is big enough that you should know it line by line. Here is the ledger as of July 2026:
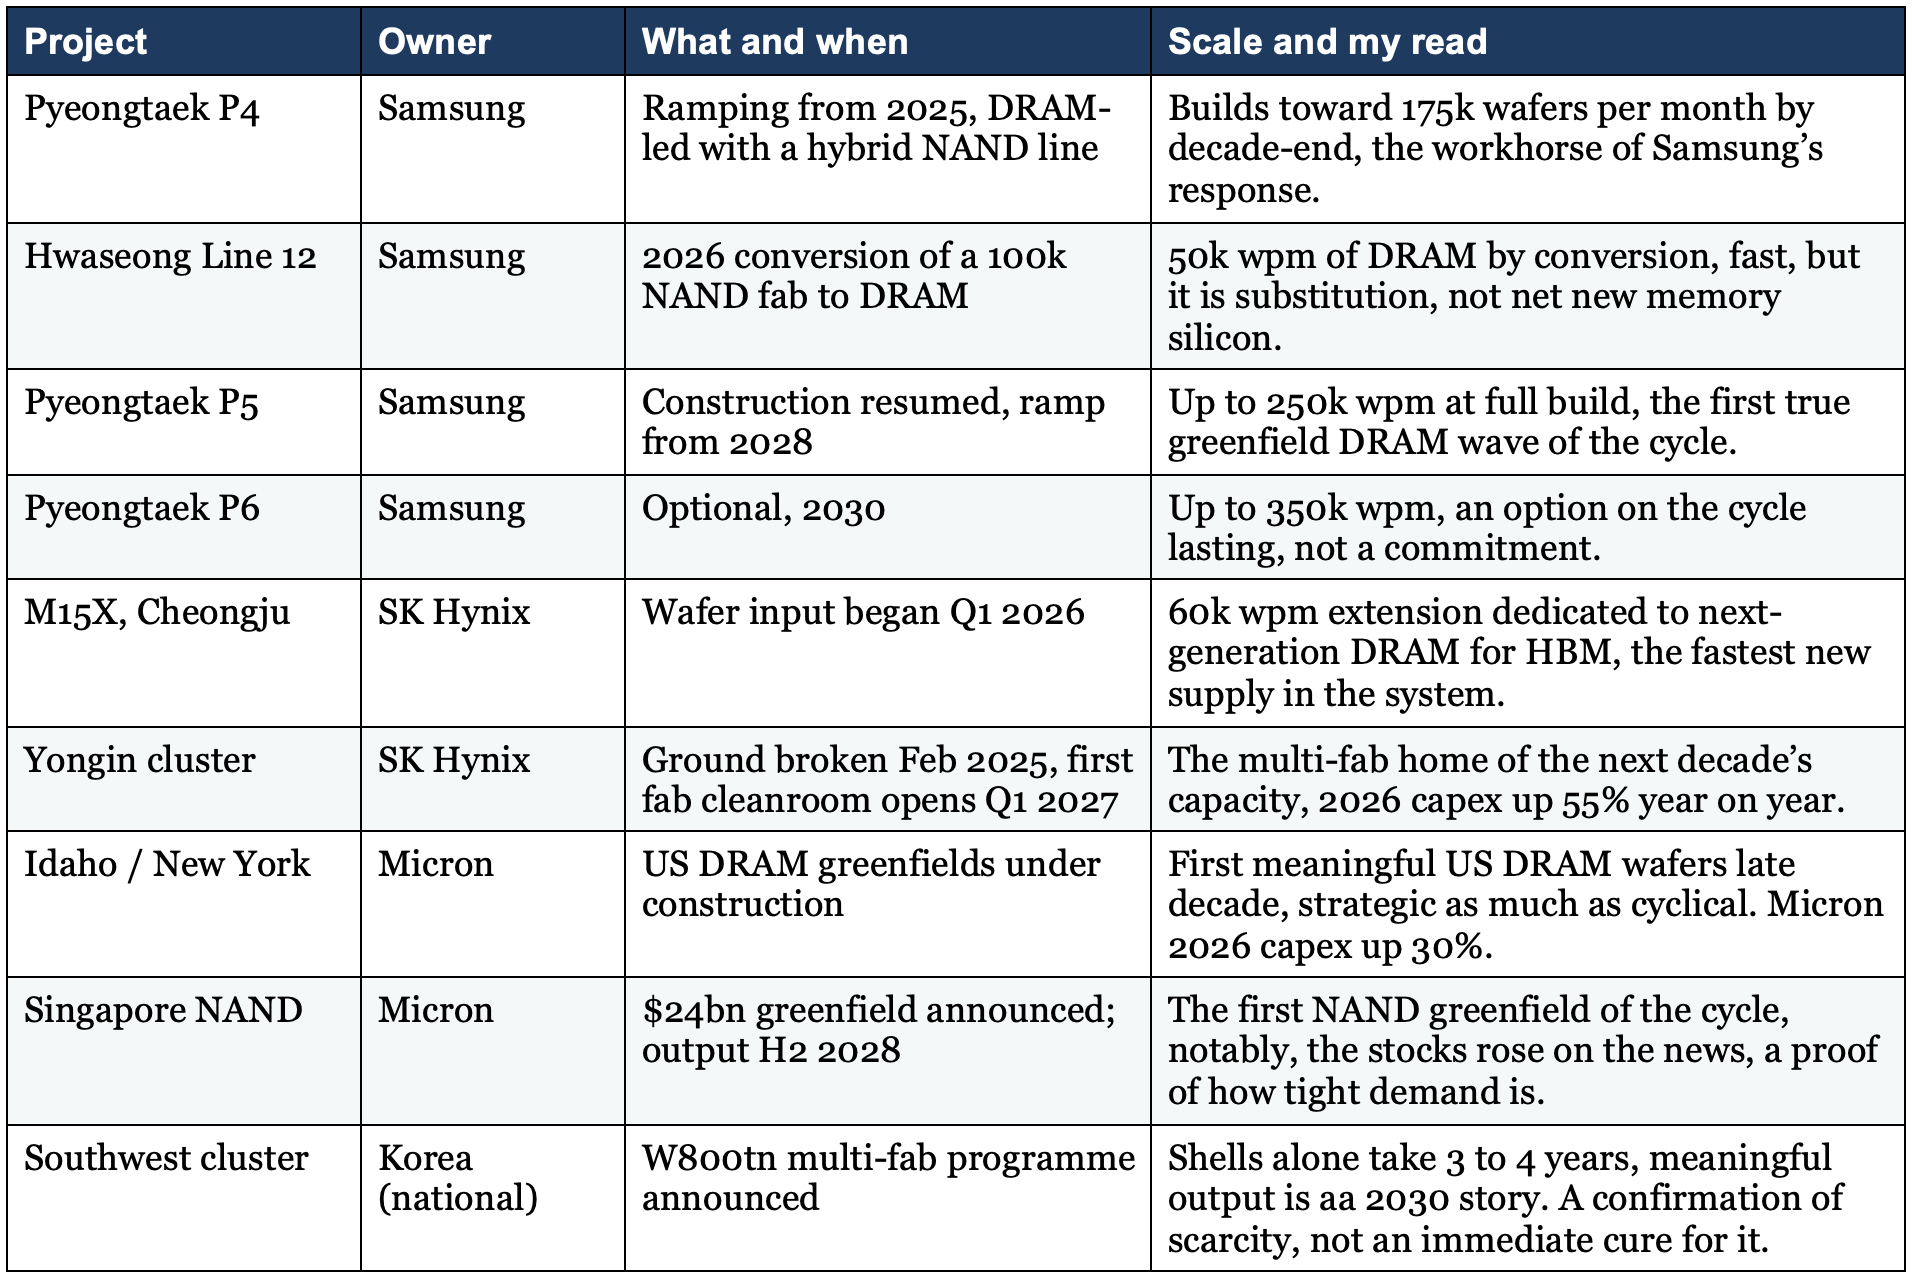
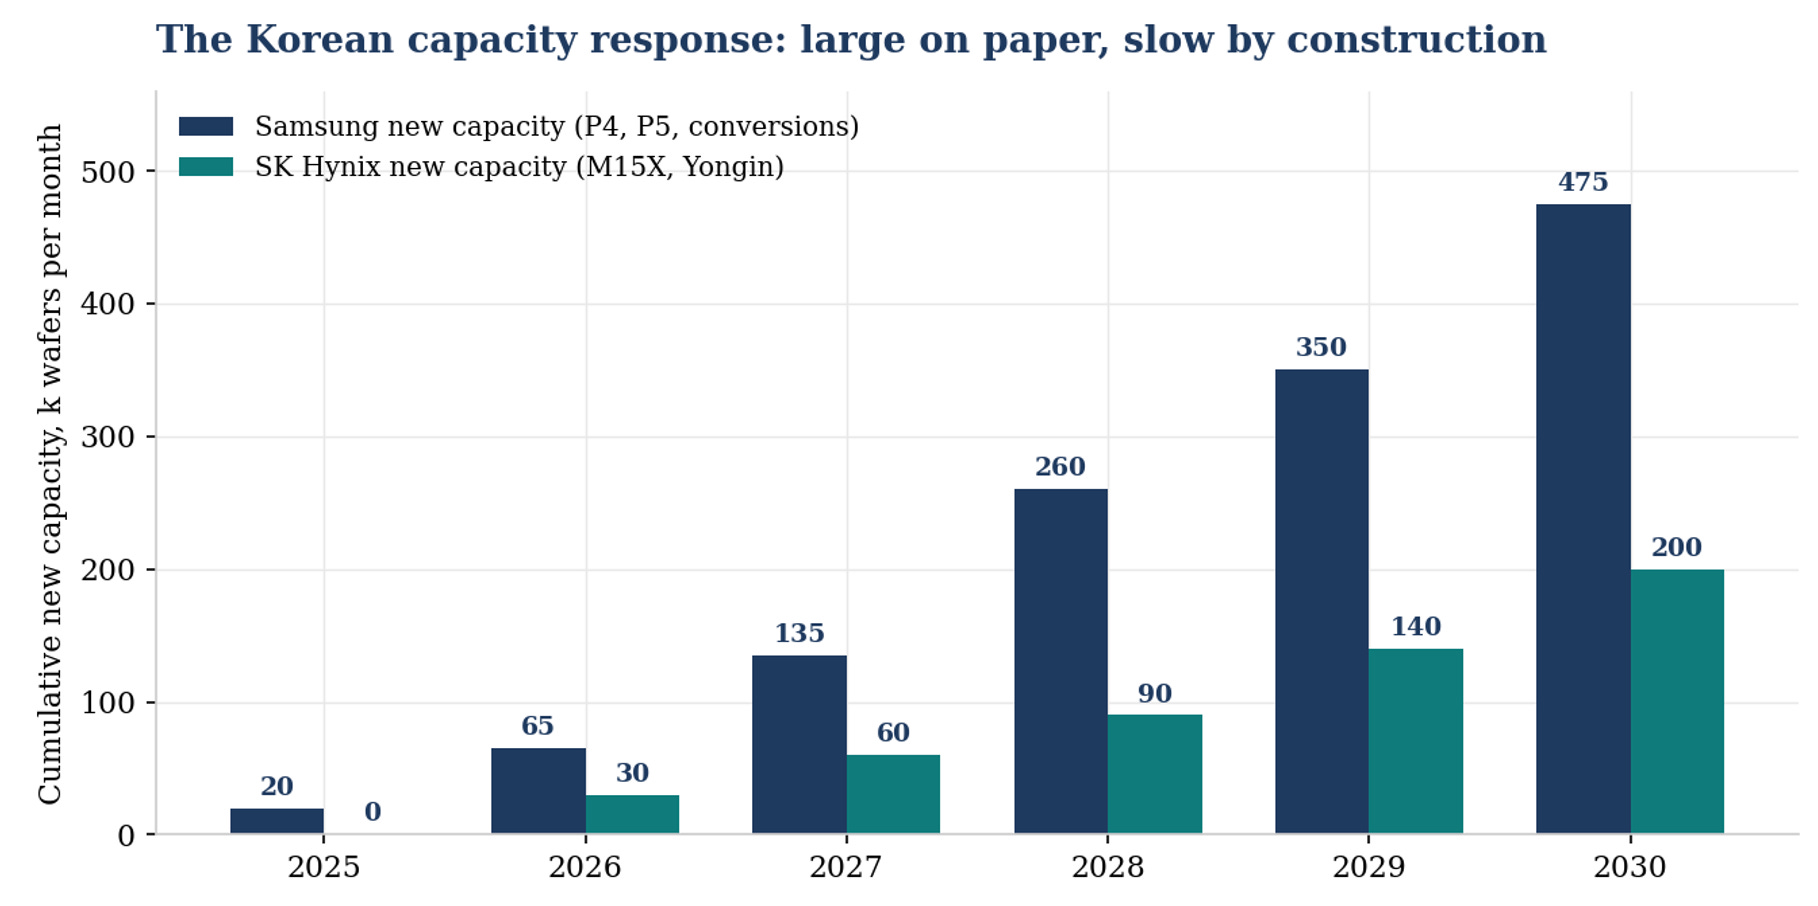
The Korean capacity response is large on paper and slow by construction: cumulative gross additions, before old-fab retirements.
Now the arithmetic that the headlines miss:
The Korean makers’ stated ambition is to roughly double DRAM wafer capacity by 2030, which sounds enormous until you annualise it: about 15% gross capacity growth a year, and once old-fab retirements and node-conversion losses are netted off, net wafer growth in the single digits annually.
Set that against bit demand compounding in the mid-20s and an HBM trade ratio absorbing three commodity wafers for every HBM wafer’s worth of bits, and the conclusion is not that the capex wave ends the shortage, it is that the capex wave is the minimum required to keep the shortage from becoming absurd.
The genuine test arrives in 2028, when P5, Yongin and the Singapore NAND fab begin producing into whatever demand environment then exists. That is the date to circle, and Section 7 debates it properly.
4. The LTA revolution: the new pricing architecture
From make-to-stock to make-to-order
If there is a single development bulls point to when they argue memory has structurally changed, it is the long-term agreement.
Historically, memory ran on a make-to-stock model: producers built capacity, manufactured bits, and sold them into a spot-and-short-contract market that cleared violently. It was a commodity sold like a commodity.
An LTA flips that: a multi-year supply agreement, often involving prepayments, volume commitments and pricing frameworks, between a large buyer (typically a hyperscaler) and a memory maker. In its sophisticated forms it starts to resemble make-to-order, closer to how a leading foundry operates than to how a commodity trades.
The foundry analogy is the heart of the re-rating argument. The leading foundry was also once viewed as a capital-intensive cyclical manufacturer and valued on price-to-book, as its earnings became visible and durable, anchored by long-term customer relationships, investors gradually grew comfortable valuing it on earnings. The claim is that if memory can make the same business-model transition, it deserves the same valuation transition.
Whether that claim survives contact with the next downturn is the trillion-dollar question, and Debate 2 in Section 7 takes it head on.
Why both sides want them
The buyers are newly terrified of memory: Cost has exploded and, more importantly, availability has become a strategic risk: if memory is the bottleneck for AI services, locking in supply at a known price is worth a lot. Memory has become a strategic asset, and the memory tax (a third of AI capex and rising) has made it a board-level line item.
The sellers want, above all else, to never relive 2023: LTAs offer what they have craved for decades: earnings and demand visibility, a smoother cycle, and the confidence to commit capital against pre-committed volume rather than against a forecast.
The anatomy: seven dials
An LTA is not one decision but a bundle of dials, each shifting risk between buyer and seller. These are the dimensions that matter:
Duration: typically 3 to 5 years, with discussions now stretching into 2029. Longer favours the supplier on visibility but raises the odds the agreed price drifts away from the market.
The fixed/floating split: what share of contracted volume is locked at a fixed price versus left to float. This is the most important lever, ranging from 100% fixed to nearly 50/50.
The anchor price: which quarter’s average sets the reference. When prices move 50%+ a year, whoever picks the anchor is implicitly taking a view on the cycle.
Asymmetric treatment of upside and downside: on the floating tranche, suppliers typically keep the upside open while customers negotiate a floor capped at perhaps 10 to 20% below baseline. The asymmetry tells you exactly who holds the bargaining power right now.
Prepayment: an upfront payment sized at perhaps 10 to 30% of contract value. This is the genuinely new feature versus prior cycles, because a prepayment is a costly, credible signal: you do not wire cash for bits you intend to walk away from.
Enforceability: take-or-pay penalties, third-party bank guarantees, or the contract underwritten as a financial instrument to give it real legal teeth. This is the clause the 2017 generation of “commitments” never had.
Capex subsidisation: whether the buyer helps fund the supplier’s capacity. Counter-intuitively, suppliers tend to resist it, because it cedes control of production strategy, it is also, in my view, one of the biggest hidden risks to the thesis, because a buyer that funds capacity once can fund a competitor’s capacity next.
The three structures on the table
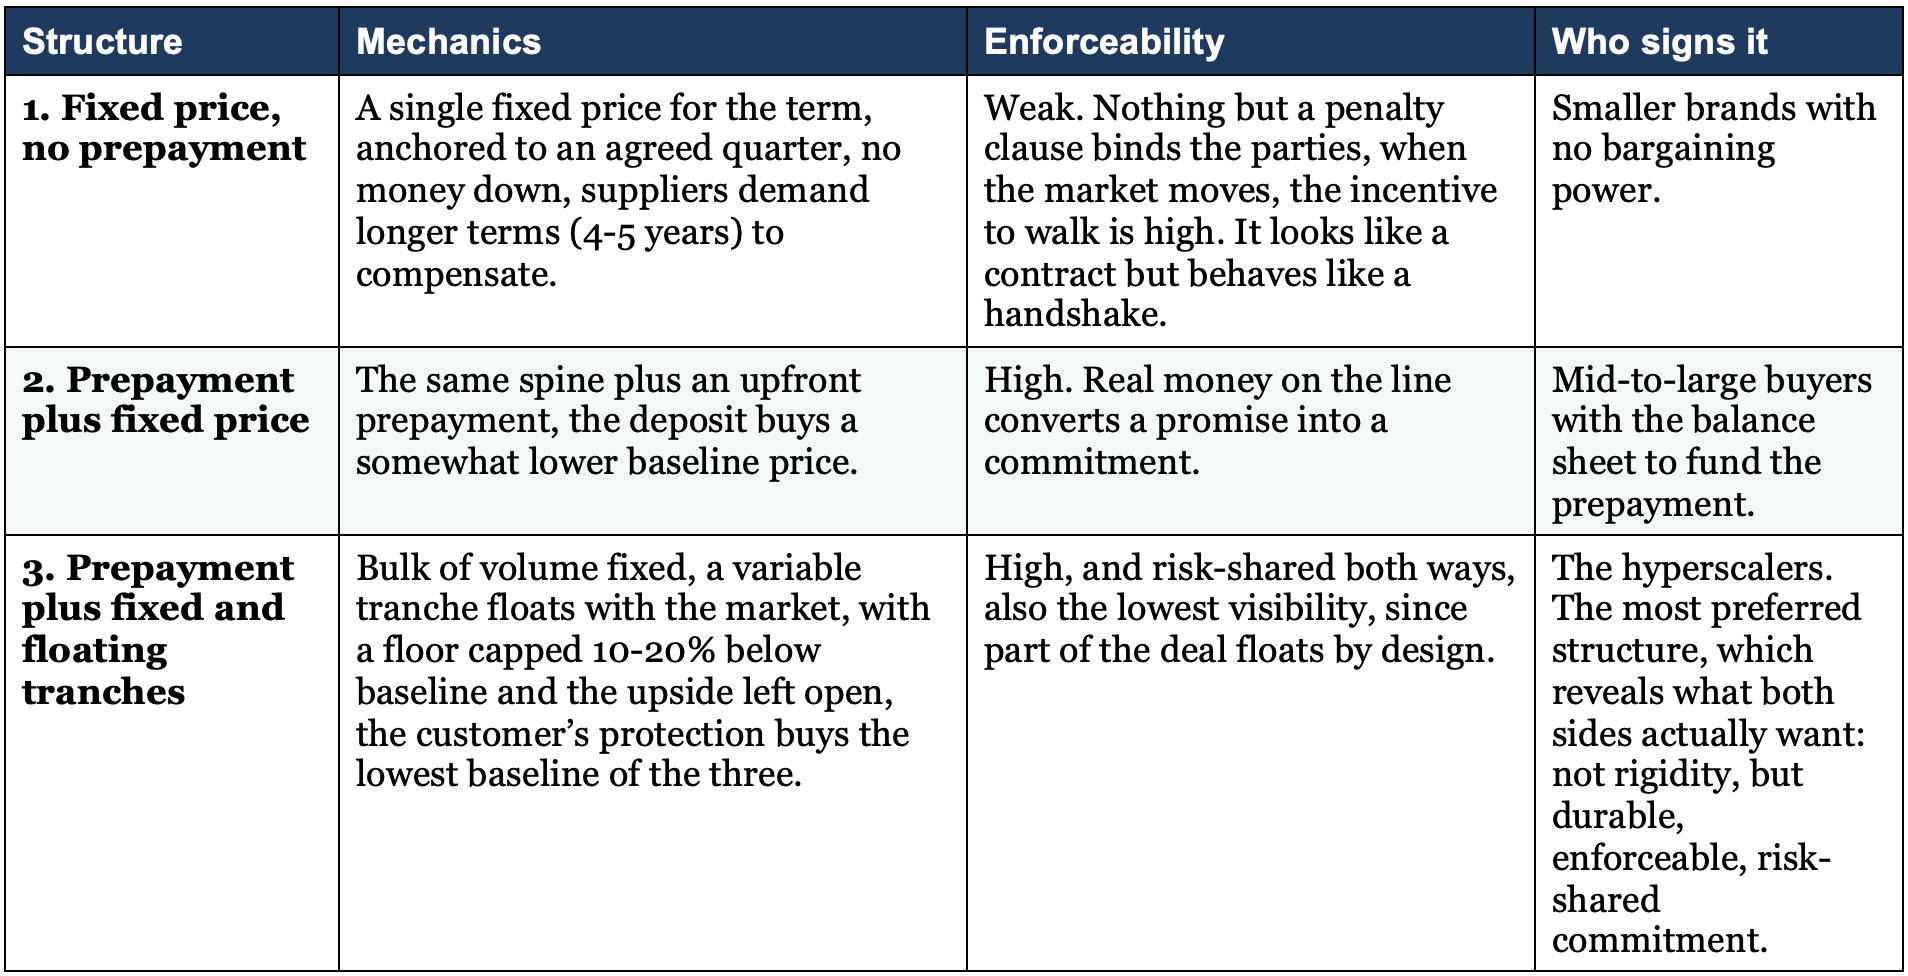
Where coverage stands today
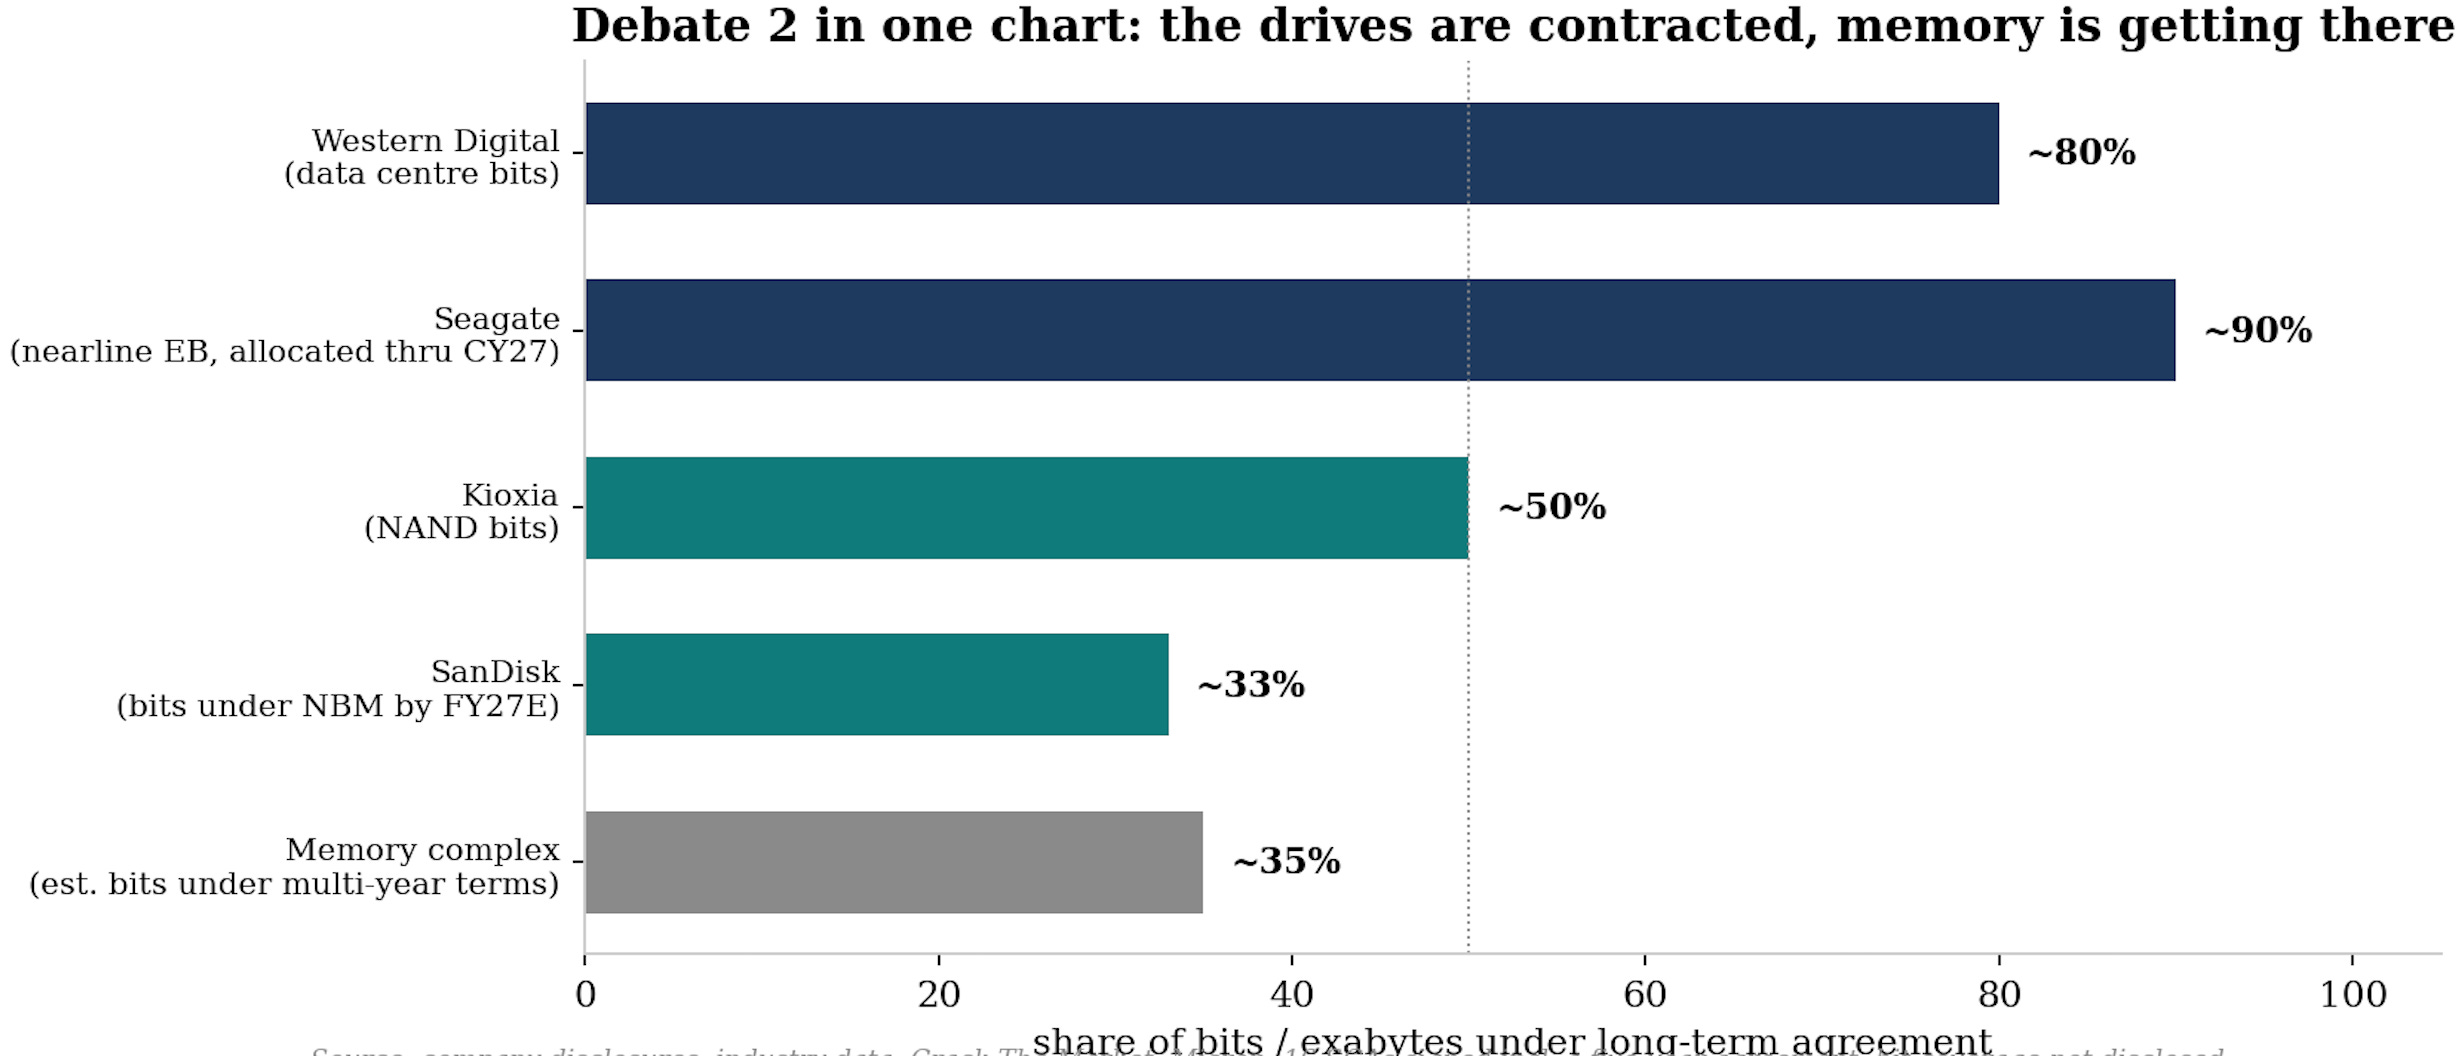
This is no longer theoretical:
Micron has signed 16 Strategic Customer Agreements spanning data center, consumer and automotive, with more in the pipeline.
Kioxia reports roughly half of its NAND bits already under LTA.
SanDisk expects about a third of bits under binding multi-year frameworks by FY27.
In hard drives, the majority of exabytes already ship under such agreements, which is precisely why that industry’s profitability stopped resembling a commodity’s some years ago.
Across the memory complex, something like a third of industry bits now sit under multi-year terms, rising toward half.
But be precise about the residual: the majority of memory revenue still reprices quarterly or faster, which means the spot machinery of Section 1.6 still sets the marginal price, and the floors underneath the contracted share have never been tested by a real downturn.
My view: The single most important historical fact to hold in mind: this movie has played before, and it ended badly. During the 2017 DRAM squeeze, forward purchase commitments were signed and did not hold, when demand slowed, prices fell more than 40% in three or four quarters, buyers pushed out shipments, and the commitments were renegotiated back toward spot. They were worth the paper they were printed on. The bull rebuttal is that today’s LTAs are deliberately engineered against exactly that failure mode, with prepayments, penalties and guarantees, and that the better analogy is the hard drive industry after 2011, where the multi-year agreements largely held and permanently changed the industry’s economics. Which analogy proves right, 2017 DRAM or post-2011 HDD, is quite literally the trillion-dollar question of this cycle, and I give my answer in Section 7.
5. Storage: NAND, the enterprise SSD wave, and the hard drive question
Where the NAND cycle stands
NAND entered this supercycle later and less violently than DRAM, and its 2026 price path already shows the shape of a maturing squeeze: quarterly contract increases of 55 to 60% in Q1, accelerating to nearly 100% in Q2. Bit demand grows in the high teens, production bit growth runs near 20% almost entirely from node migration and layer stacking, and industry wafer capacity actually declines as the leader reallocates cleanroom space to DRAM. Capex intensity, which averaged 20 to 50% of sales across the last fifteen years, sits near historic lows, and the discipline is holding for now: pricing is accelerating and fast.
The mix shift underneath is the real story:
QLC output is ramping hard across every maker as fabs convert lines to feed high-capacity enterprise drives, which cannibalises the supply of standard consumer flash and drags consumer prices up even where consumer demand is soft.
And the demand side has a new anchor: the data center becomes NAND’s largest end market in 2026, enterprise SSD exabytes grow at rates above 60% this year, and the leading US maker (SanDisk)’s data-center NAND business alone now clears $1bn a quarter. Micron’s data-center SSD revenue exceeded $5bn in the quarter and more than doubled sequentially.
The supply structure: who is actually adding NAND bits
Underneath the aggregate, the 2026 supply structure tells you where discipline is real and where it is not.
The leader is cutting NAND wafer capacity by over 20% as cleanroom space migrates to DRAM and HBM, yet still grows bits around 10% through node migration.
Kioxia grows bits around 21% on wafer additions of only 4%, SK Hynix grows bits about 13% on wafers down 2%, Micron grows around 18% ahead of its Singapore greenfield.
The outlier is YMTC: bit growth near 50% on wafer additions of roughly 25%, making China the only meaningful adder of raw NAND wafers in the world this year.
Read that carefully: ex-China, NAND supply growth is now almost entirely technological (layers and QLC conversion), which is the slowest and least reversible form of supply, while the marginal wafer belongs to a player outside the oligopoly’s discipline and the US hyperscaler value chain. Both facts matter, in opposite directions, and both feed the debates in Section 7.
The enterprise SSD wave: NAND’s premium outlet
The structural upgrade inside NAND is the enterprise SSD. The data center becomes NAND’s largest end market in 2026, with data-center bit demand revised up repeatedly through the year, from mid-20s growth to mid-40s to the high-60s now expected, and the eSSD value pool on some estimates could eventually rival HBM’s.
Three things make this segment categorically better business than the flash of old:
Qualification is the moat. A hyperscaler eSSD win takes quarters of joint validation across controller, firmware and NAND, a qualified drive cannot be second-sourced from a spot market. The vertically integrated makers (own NAND, own controller, own firmware) are structurally advantaged, which is why controller independence has become a strategic asset rather than a cost line.
QLC changed the economics. High-capacity QLC drives (30TB, 64TB, 122TB) are the vehicle attacking the nearline tier, and the engineering frontier, writing directly to QLC without the performance cliff of an exhausted cache, is exactly the kind of differentiation a commodity is not supposed to have. QLC output mix is ramping across every maker, cannibalising standard flash supply and propping consumer prices even where consumer demand is soft.
The contracts arrived here first. Roughly half of Kioxia’s bits already ship under LTAs, SanDisk expects about a third of bits under binding multi-year frameworks by FY27, and prepayments are attached. The margin proof is public: SanDisk gross margins have stepped from around 50% to guidance near 80%, unheard of for flash.
And the demand tail keeps growing: inference architectures are being designed with large NAND pools attached for KV-cache offload and context storage, a configuration that alone could add 75 to 100 exabytes of demand in 2027 and roughly double that in 2028, none of it in most models a year ago.
The honest caveat is elasticity: NAND’s consumer half is the most price-sensitive demand in semiconductors, de-speccing is already underway, and blended ASPs will feel it. The eSSD wave upgrades NAND’s mix, it does not repeal NAND’s structure.
The hard drive question
At the bottom of the pyramid sits the industry that the memory bulls should study most closely, because it already made the transition memory is attempting.
Hard drives consolidated to an effective duopoly, shifted the majority of exabytes onto multi-year agreements after 2011, cut capital intensity to roughly 5% of sales, and now run sold out years in advance with visibility memory makers can only envy.
The market has rewarded it: hard drive vendors trade in line or at a premium to the semiconductor index (at 50x 2026 PE), while memory makers, even after their re-rating, still trade at a discount on forward earnings (HSD NTM PE).
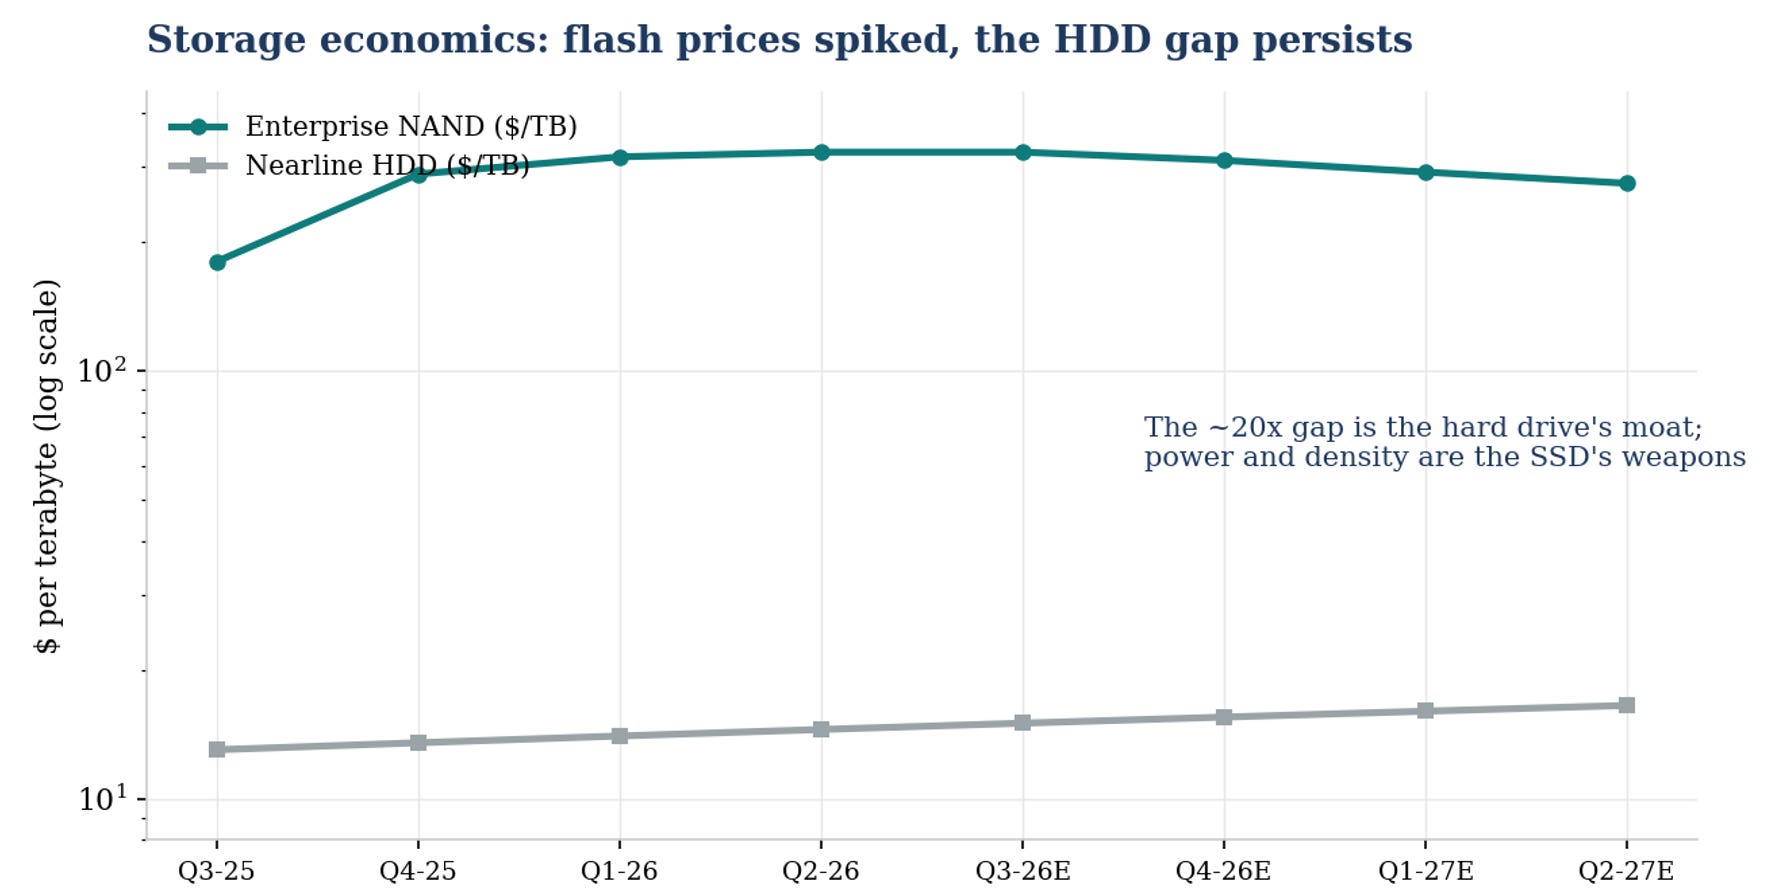
Enterprise NAND spiked to over $320 per TB before easing, nearline drives sit near $15. The 20-30x gap is the drive’s moat, power, density and access speed are the SSD’s weapons.
The drive industry deserves more respect than the flash industry gives it, because it quietly completed the transition memory is attempting now. Start with the industrial structure.
Two companies (Seagate and Western Digital) ship over 90% of enterprise exabytes, a third participant is fading toward single digits, and there is no Chinese entrant, no greenfield capacity anywhere on earth, and no credible path to one, because the tooling, the media chemistry and the head technology are locked inside the incumbents.
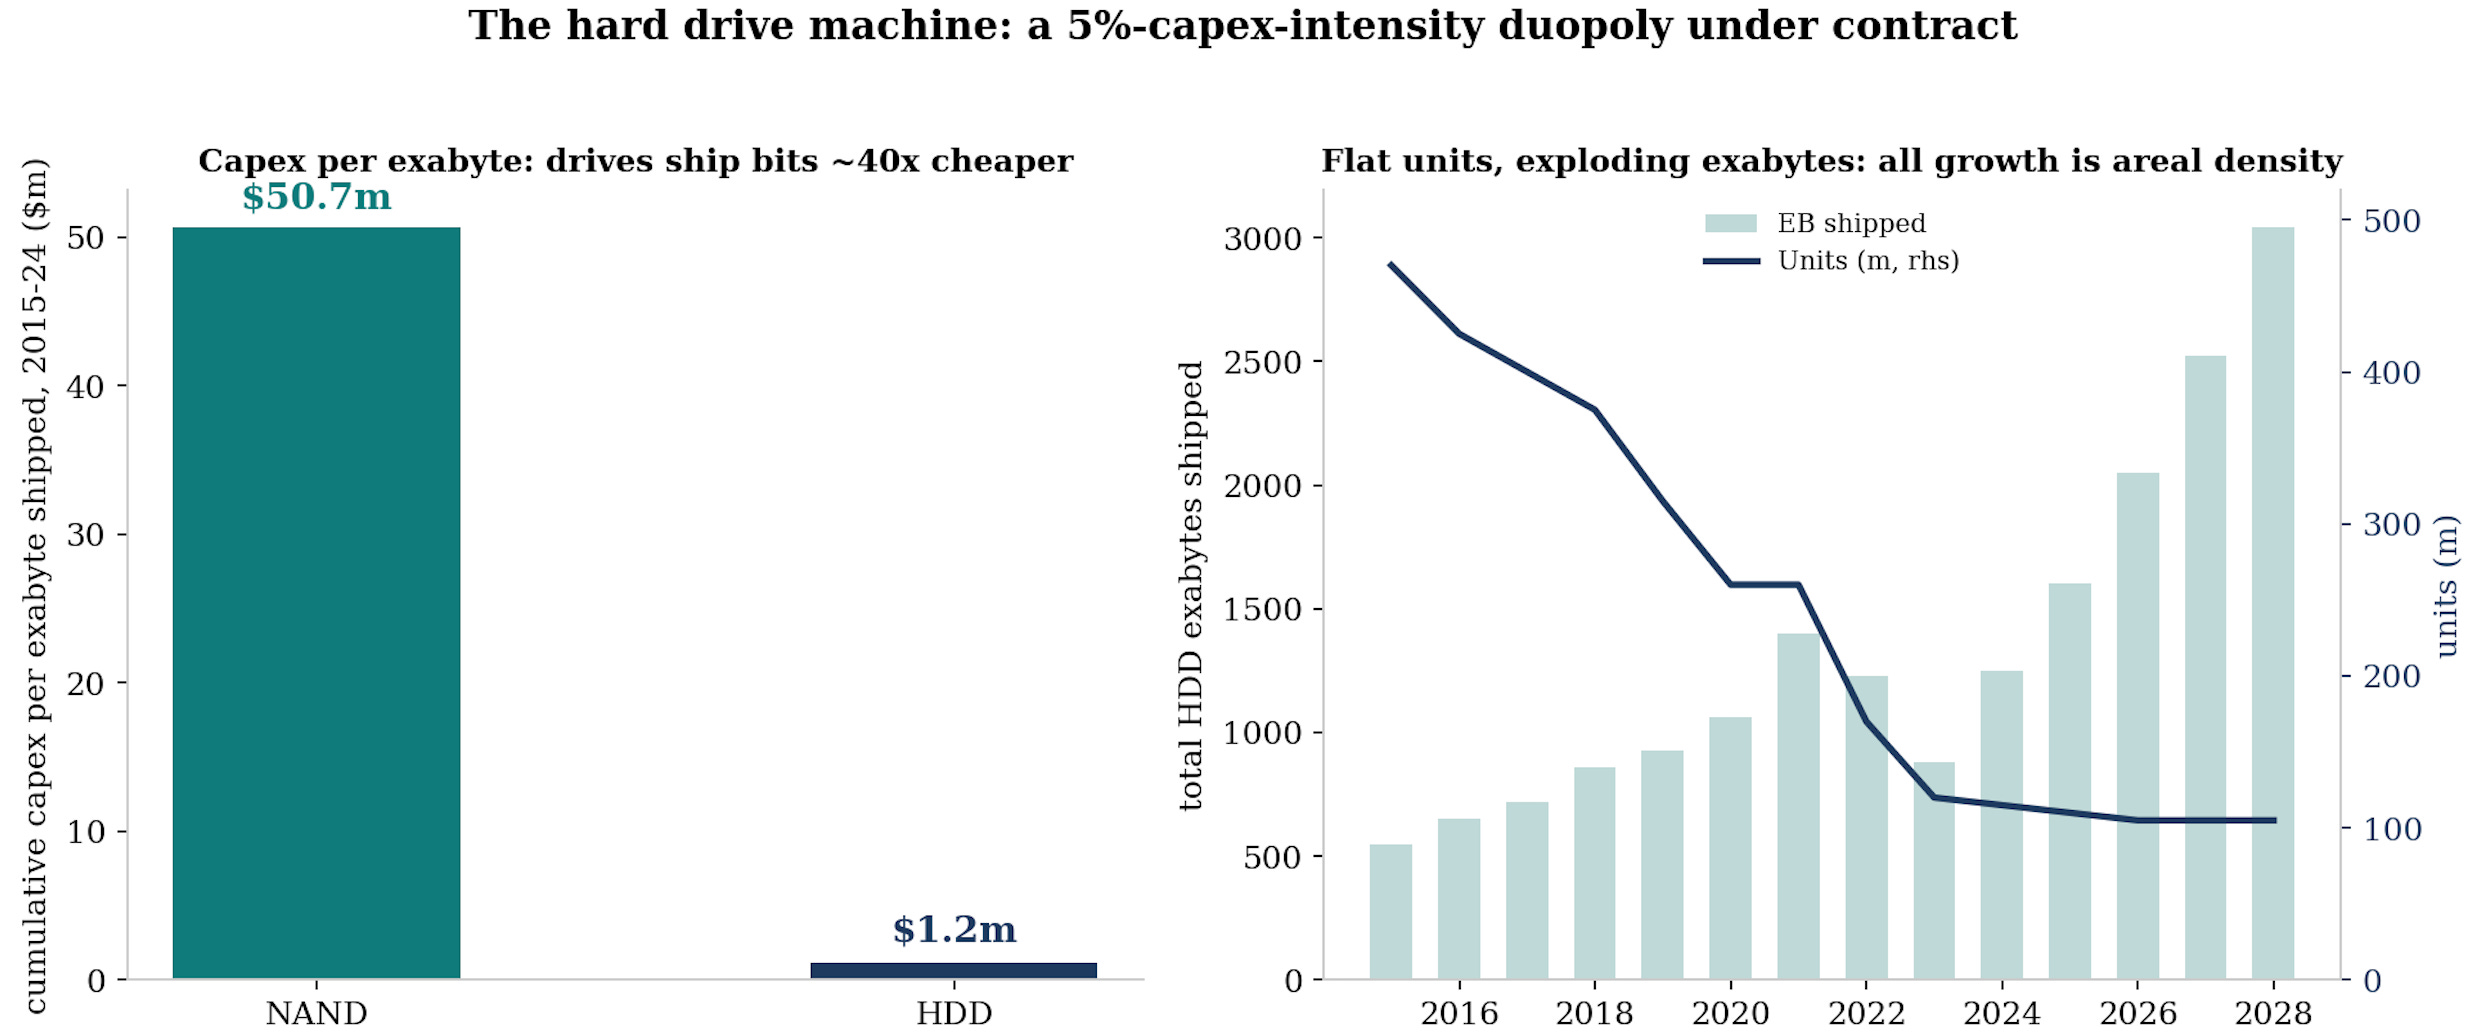
Unit shipments have been flat near 100 to 110 million drives a year since the client business collapsed, which means the industry stopped building factories and started sweating assets.
All exabyte growth, running at a roughly 24% annual clip through 2028, comes from area density, from drives moving to 3, then 4, and on the visible roadmap toward 10 terabytes per platter.
The economics that fall out of that structure are extraordinary and almost never quoted. Over the last decade the NAND industry spent roughly $50m of capex for every exabyte it shipped. The drive industry spent about $1.2m. That forty-fold gap is why drive-maker capex sits near 5% of sales while flash lives at 30 to 50%, why free cash flow conversion (25-30%) at the duopoly now embarrasses most of the semiconductor industry, and why the cheapest cold byte on earth stays on a spinning platter for as far as any roadmap sees.
The contract structure is further along than anywhere in memory:
The majority of enterprise exabytes already ship under long-term agreements with volume and price conditions, nearline supply is effectively allocated through 2027 with conversations extending into 2028 and 2029, and one maker discloses that roughly 80% of its data-center business sits under such agreements.
This is why drive-maker gross margins broke out of their historical band and why the market re-rated the pair from a low-teens multiple to a premium over the semiconductor index.
The drives are the proof of concept for the entire LTA thesis of Section 4, and also its cautionary footnote, because the re-rating happened only after coverage was demonstrated across several quarters, not when it was announced.
The technology race matters more than usual right now:
One maker leads in heat-assisted recording with its 3TB-per-platter generation qualified across the US hyperscalers and a 4TB-per-platter generation sampling, while the other extended conventional recording further than anyone expected and is qualifying its own heat-assisted drives at four customers for a 2027 ramp.
Execution risk on these transitions is the main company-specific risk in the space, since a maker that stumbles on the density roadmap cedes exabyte share in a market where capacity is pre-sold.
There is also a bear case at the heart of storage:
Inference is warming data that used to sleep, drives cannot serve high-IOPS workloads, and high-capacity QLC solid state is attacking the warm-storage boundary from above with power and density arguments that resonate in power-constrained data centers.
The honest counter is arithmetic: Flash would need to close a 20 to 30x cost-per-terabyte gap while its own capacity is sold out and its prices are up triple digits, and the flash industry has neither the spare bits nor the economic incentive to chase the cold tier.
Displacement at the boundary is real. Displacement of the bottom of the pyramid is not on any five-year horizon.
On displacement, run the actual total-cost math before picking a side:
The roughly 20-30x cost-per-terabyte gap is the drive’s moat, and for genuinely cold data it is decisive: no power, density or reliability argument overcomes paying twenty times more to store a byte nobody reads.
The SSD’s weapons win at the other end: AI workloads need parallel access that spinning media cannot deliver, matching one dense rack of 122TB drives takes thousands of spindles, and in a power-constrained data center the watts saved are worth real money.
The battleground is the warm middle, nearline-adjacent data that is read often enough for access economics to matter, and that is where QLC is aimed.
What the displacement framing misses is that the drive industry’s own shortage, with nearline sold out into 2027 and beyond, is part of what created the eSSD surge in the first place: flash is filling a gap as much as taking a market.
My view: I think displacement is the wrong frame. Under a genuine data flood, the hierarchy does not cannibalise itself, it fills from the top: hot data overflows HBM into DRAM, warm data overflows into flash, cold data overflows into drives, and every tier’s absolute demand grows even as relative shares shift. The investable version of the debate is different: the drive duopoly offers the most durable profitability per unit of risk (contracts held, capex 5% of sales, no Chinese entrant), while NAND offers the higher torque on AI upside with the weaker industry structure (five clusters, elastic demand, a Chinese entrant scaling). DRAM sits above both on structure and below the drives on proven contract durability. That ranking, not a displacement call, is what feeds the selection piece later in the series.
6. The value chain: three ways to own the theme
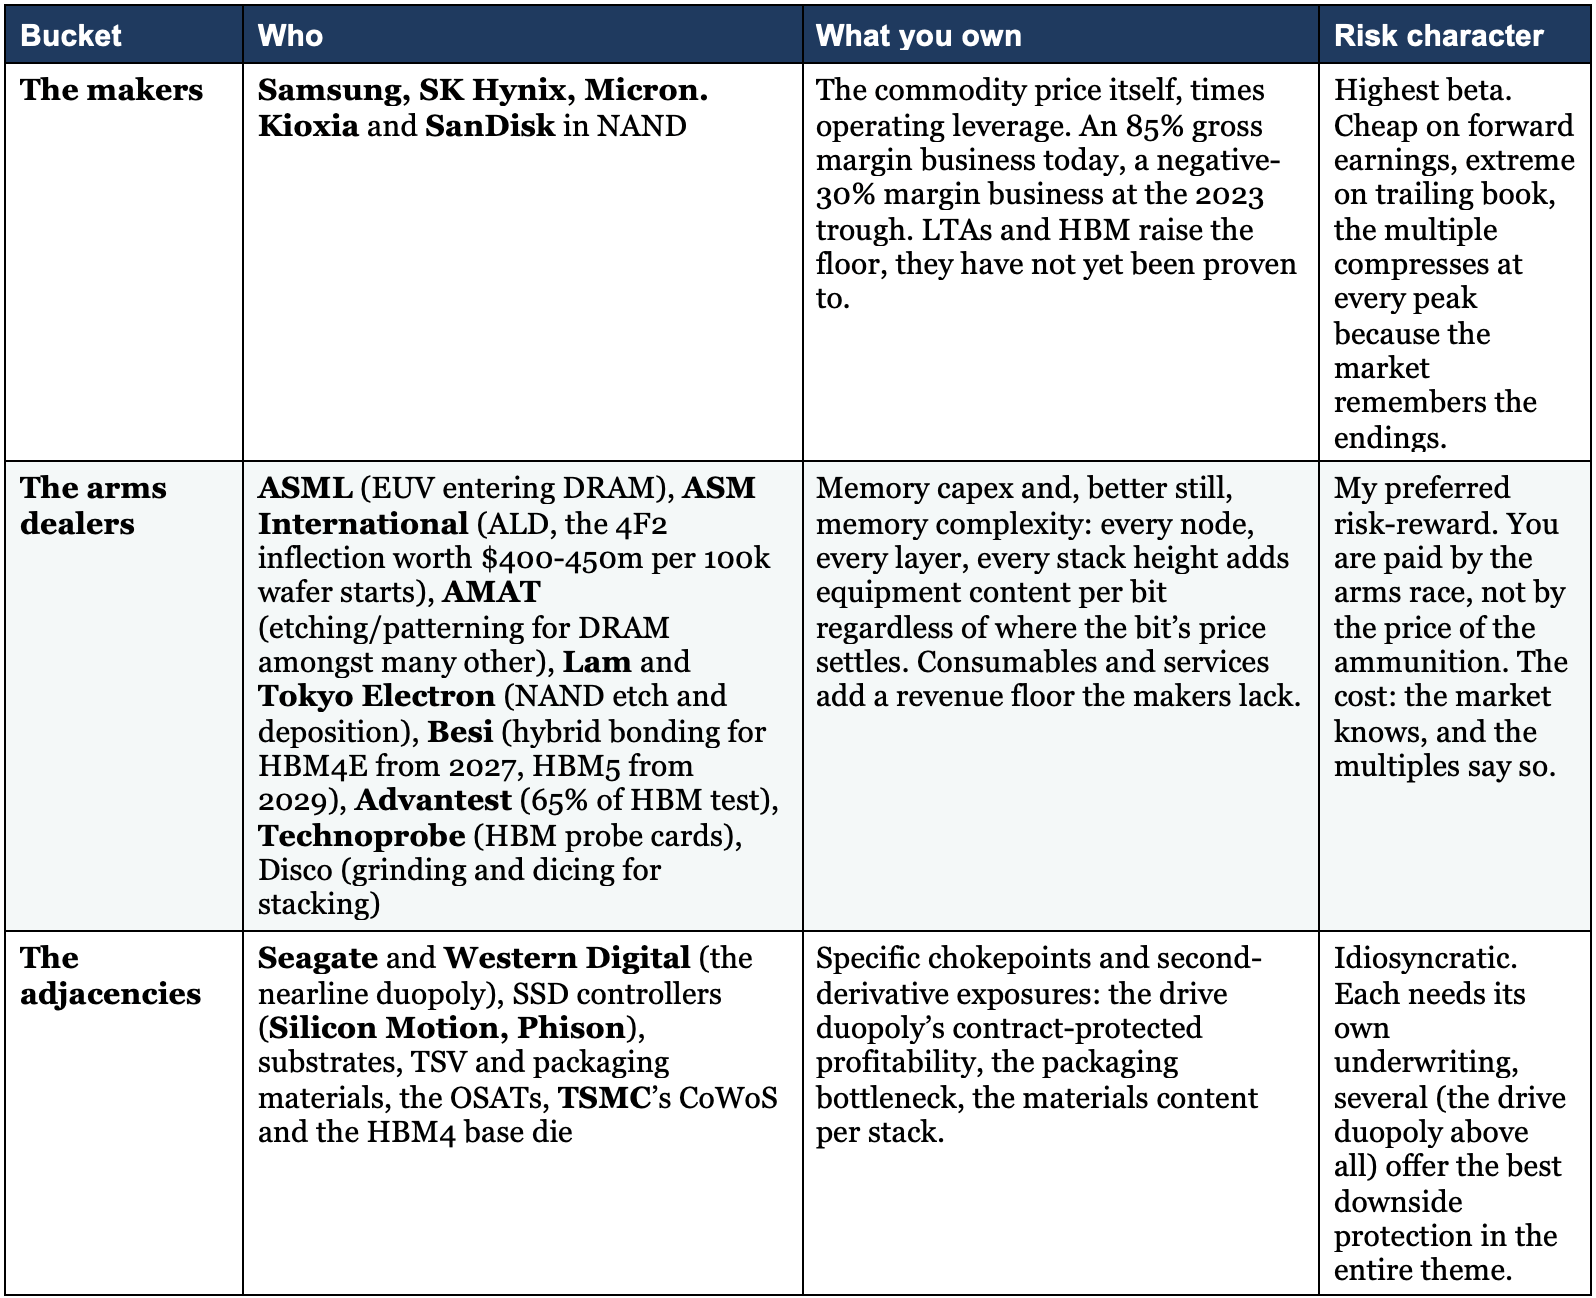
You can own this theme at three points in the chain, and they are very different trades.
The makers give you the commodity price with operating leverage: the highest beta, in both directions.
The equipment and test suppliers, the arms dealers, give you the capex and complexity growth without the commodity price risk: my preferred risk-reward, for reasons the table makes obvious.
The adjacencies give you idiosyncratic angles on the same wave.
Deep dives on many of these names are already live on CTM and this is of course not an exhaustive list.
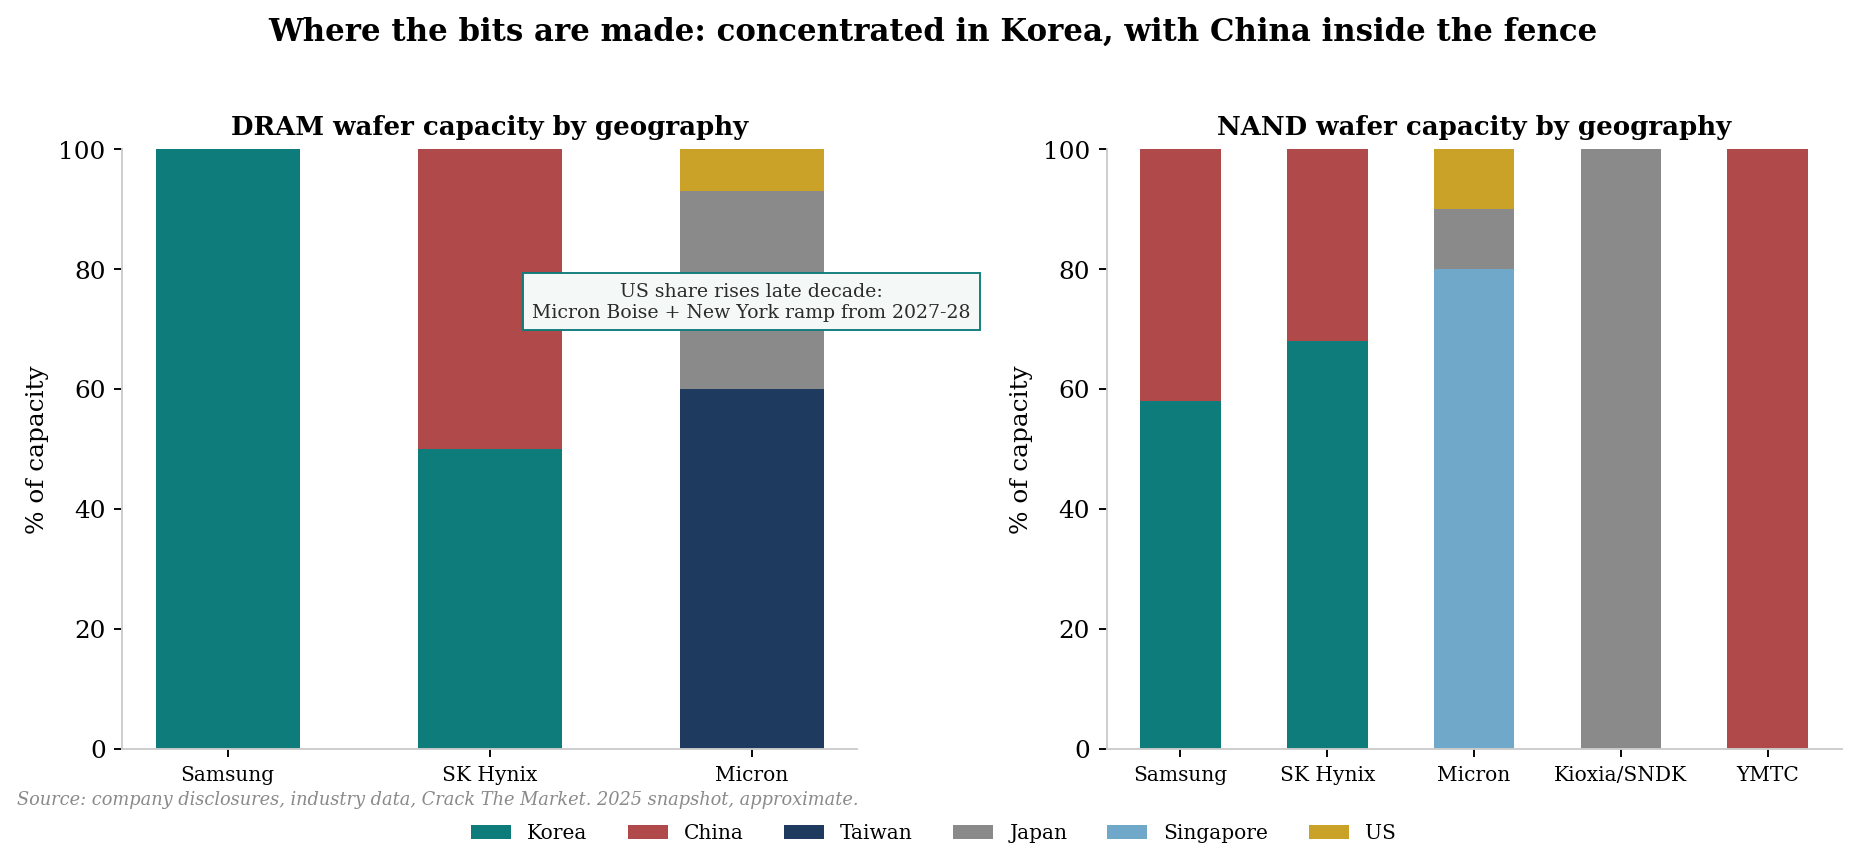
Source: Crack The Market. Company-level work: see the CTM deep dives on Micron, SanDisk, ASML, ASM International, Besi and Technoprobe.
The arms dealers are in full blown supercycle
The picks-and-shovels are very compelling in my view, because each process step is its own chokepoint with its own memory-specific kicker.
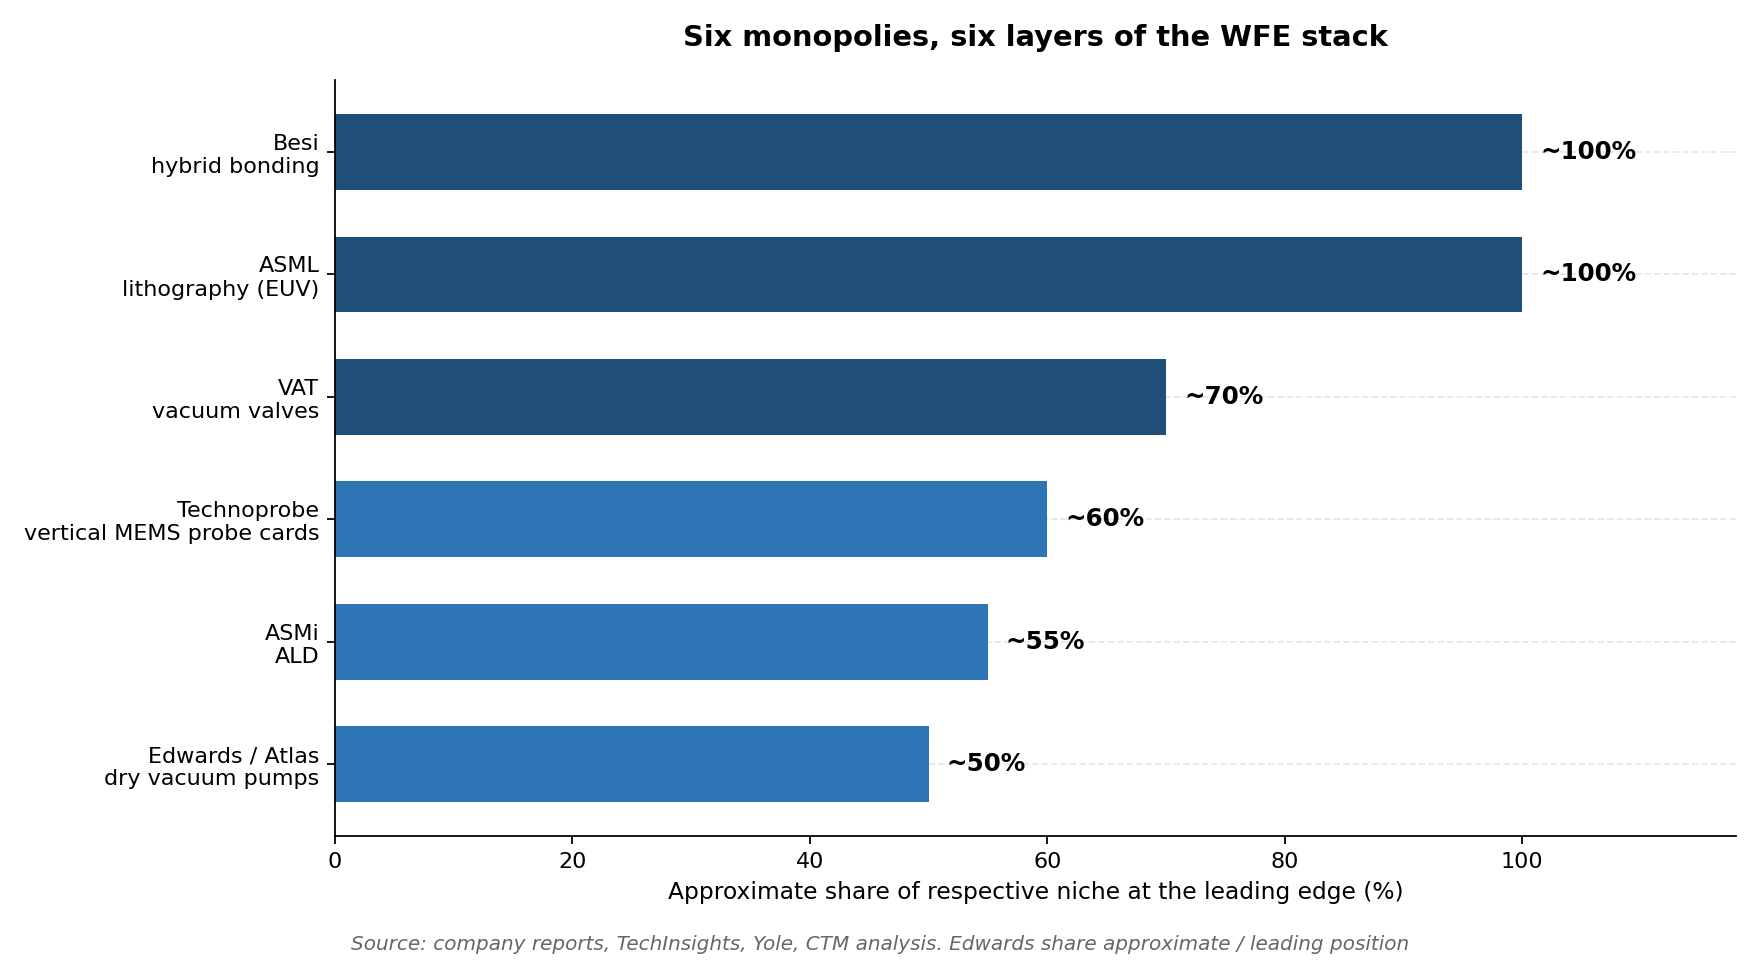
Largely linked to this memory singularity (but also to the very strong logic/foundry demand due to AI), we are entering a full blown WFE/semicap supercycle that has no precedent (which I have covered in my Six Monopolies, One Supercycle: EU Semicaps piece):
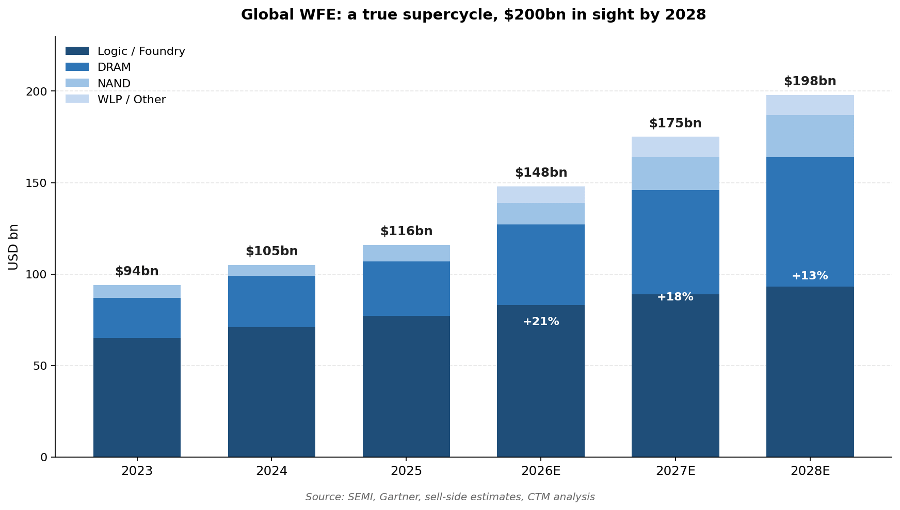
WFE spending finished 2025 at roughly $116bn.
The latest forecast walk-through is $148bn for 2026 (+28% YoY), $175bn for 2027 (+18% YoY), and $198bn for 2028 (+13% YoY). Twelve months ago the same forecasters had 2027 at $130bn and 2028 at $145bn. Three months ago they had 2026 at $132bn and 2027 at $158bn.
The forward curve has shifted higher at every refresh, and the direction of travel is unmistakable. We are entering a $200bn WFE world inside two years, versus the $50bn pre-2020 baseline. This is the magnitude of a true supercycle.
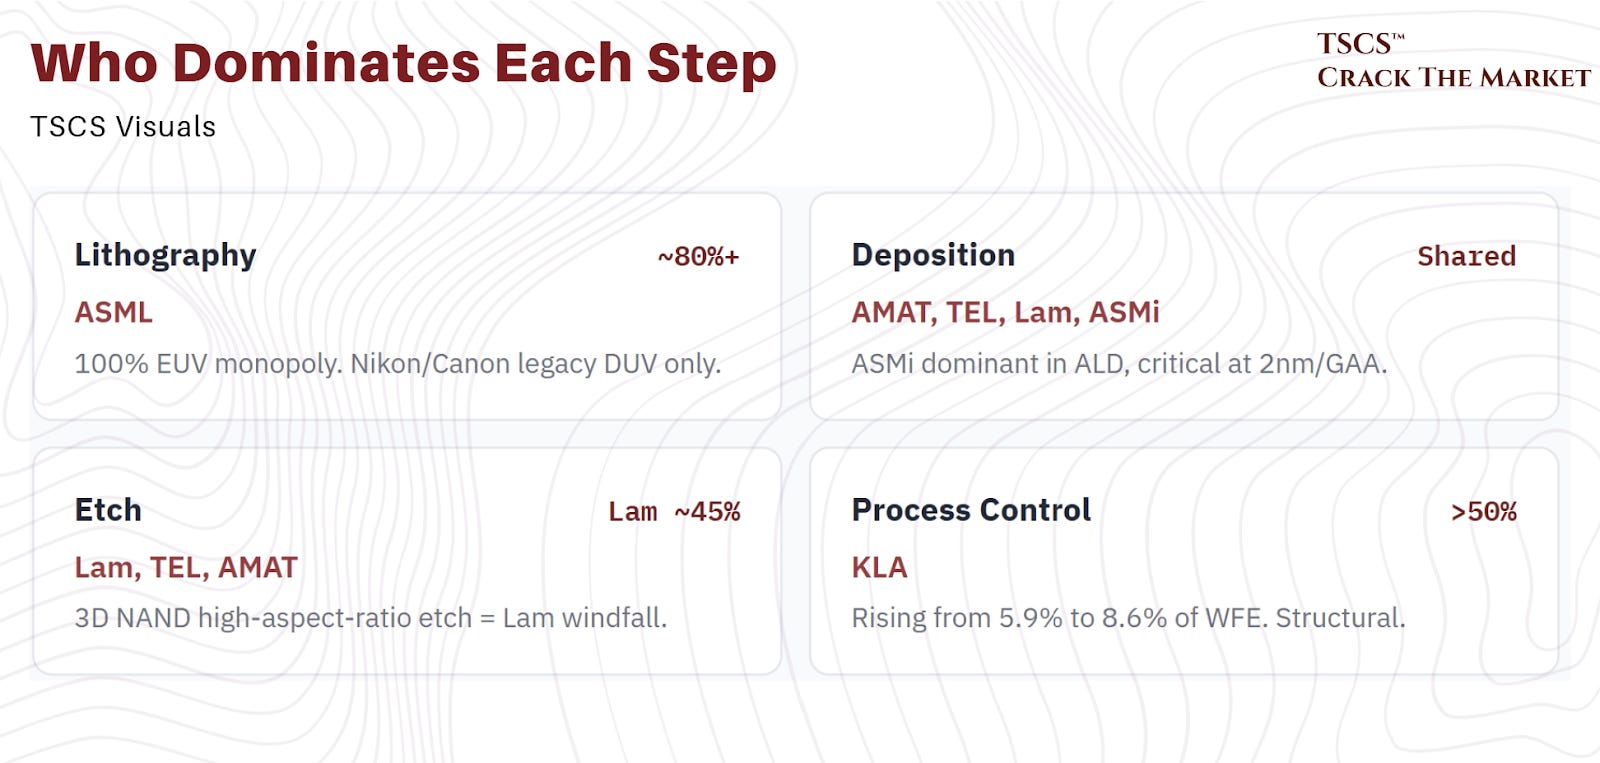
Lithography: EUV finally enters DRAM
NAND famously needs no EUV, DRAM increasingly cannot live without it.
EUV entered DRAM around the 1a generation and the layer count grows with every node, which makes DRAM lithography spend one of the fastest-growing lines in the entire equipment market as 1c and 1-gamma conversions run alongside the greenfield wave.
ASML, the monopoly supplier of the tool needs no introduction to CTM readers, the memory angle is that DRAM has moved from a marginal EUV customer to a structural pillar of the order book, precisely as the logic cycle matures. See the ASML deep dive for the full case.
Deposition: the capacitor, and the 4F2 prize
DRAM’s defining structure, the extreme-aspect-ratio capacitor, is built with atomic layer deposition of high-k materials, the franchise of the Dutch ALD leader ASM International.
The coming 4F2 cell transition, with vertical channel transistors and logic-style materials stacks, adds an estimated $400 to 450m of addressable market per 100k wafer starts per month as orders begin around 2027, and the eventual move to 3D DRAM stacks the opportunity again.
Memory is migrating from under 20% of the ALD leader’s revenue toward a quarter and beyond: the memory business is becoming logic-like, and the logic toolmakers are the beneficiaries. The ASM International deep dive covers this inflection in full.
Etch: the layer race is an etch problem
Every NAND layer generation is won or lost drilling billions of channel holes through 300-plus stacked layers with nanometre straightness, which makes the layer race a structural annuity for the high-aspect-ratio etch leaders (LAM Research, Applied Material and Tokyo Electron) and explains why the NAND recovery is their beta.
Cryogenic etch, cutting hole-drilling time dramatically, is the current battleground between the American and Japanese incumbents. DRAM’s capacitor etch is the same physics pointed at a different structure.
I haven’t yet covered those names but they are on my roadmap.
Bonding and packaging: where the HBM stack is actually built
Today’s HBM towers are assembled with thermo-compression bonding, a niche a single Korean toolmaker (Hanmi) dominates with roughly 65% share on the back of the HBM leader’s volumes.
The generational fight is what comes next: copper-to-copper hybrid bonding enters HBM at the HBM4E generation from around 2027 and is expected to take the majority of stacks by HBM5 toward 2029, and the equipment intensity is startling, with stacking 16 to 20 dies per package implying an intensity ratio of one HBM bonder for every four to six logic bonders’ worth of output, hundreds of incremental tools for the die-to-wafer bonding monopolist.
The caveat that keeps the debate honest: some memory makers are exploring wafer-to-wafer bonding, a different toolset, as an alternative path.
The Besi deep dive dissects exactly where that thesis breaks.
Test: the cost of failure went exponential
A defective 12-high HBM stack costs over $1,000 in components, integrated onto a $50,000 accelerator, it destroys the package.
So the industry tests more, earlier, and at every integration step: HBM requires multi-insertion testing (pre-stack, stack, post-stack) that conventional DRAM never needed, lifting test content per bit by a factor of three to five.
The current tester leader (FormFactor) holds roughly 65% of HBM test, on the consumable side, the HBM probe card market scales from around $0.6bn in 2026 toward $1.8bn by 2029, from essentially zero in 2024, with the vertical-MEMS leaders qualified or qualifying at all three makers.
Test is the quietest and, per unit of risk, perhaps the cleanest memory derivative in the market, the Technoprobe deep dive makes the case.
Grinding, dicing and materials: the unglamorous chokepoints
Every die in every stack must be thinned to tens of microns before TSVs work, and the Japanese grinding and dicing leader (Disco) holds roughly 80% of that step, more dies per stack means more grinds per bit, mechanically.
Around it sit the TSV plating chemistries, bonding films, carrier wafers and substrates whose content scales with stack height, and, one level up, the advanced packaging capacity itself, where the leading foundry (TSMC)’s interposer output is a bottleneck for the whole AI complex and, from HBM4, the foundry becomes a direct participant in the memory stack through the logic base die.
Disco is also on my roadmap.
The adjacencies, briefly
Three adjacencies round out the map:
The nearline drive duopoly (Seagate and Western Digital), covered in Section 5, is the proven-contract ballast of the theme.
Independent SSD controller vendors (Silicon Motion, Phison) ride eSSD unit growth from the makers who are not vertically integrated, a smaller but geared expression.
And the OSATs (like Amkore or ASE) participate wherever memory packaging outgrows the makers’ own back ends.
Each needs its own underwriting, none should be bought as a generic memory proxy.
The mechanism that links the buckets
One mechanism deserves emphasis because it links the buckets: memory’s complexity growth is structurally faster than its bit growth.
EUV layers rise per DRAM node, the 4F2 and eventual 3D DRAM transitions re-tool the fab, NAND layer counts head past 400 with hybrid bonding attached, HBM stacks climb from 8-high to 16-high with a logic base die and, on the roadmap, copper-to-copper bonding, and test intensity rises with every die added to every stack.
Equipment content per bit rises even in the makers’ bear case, which is precisely why the arms dealers are the risk-adjusted core of how I would own this theme, with the makers sized as the high-beta satellite.
The full stock-by-stock ranking is the next piece in this series.
7. The great debates: bull, bear, and my view
Everything above is the factual record. What follows is the breakdown of some of the numerous debates in the market around memory which decide whether memory should be owned here.
For each debate I give the bull and bear arguments honestly and then my view.
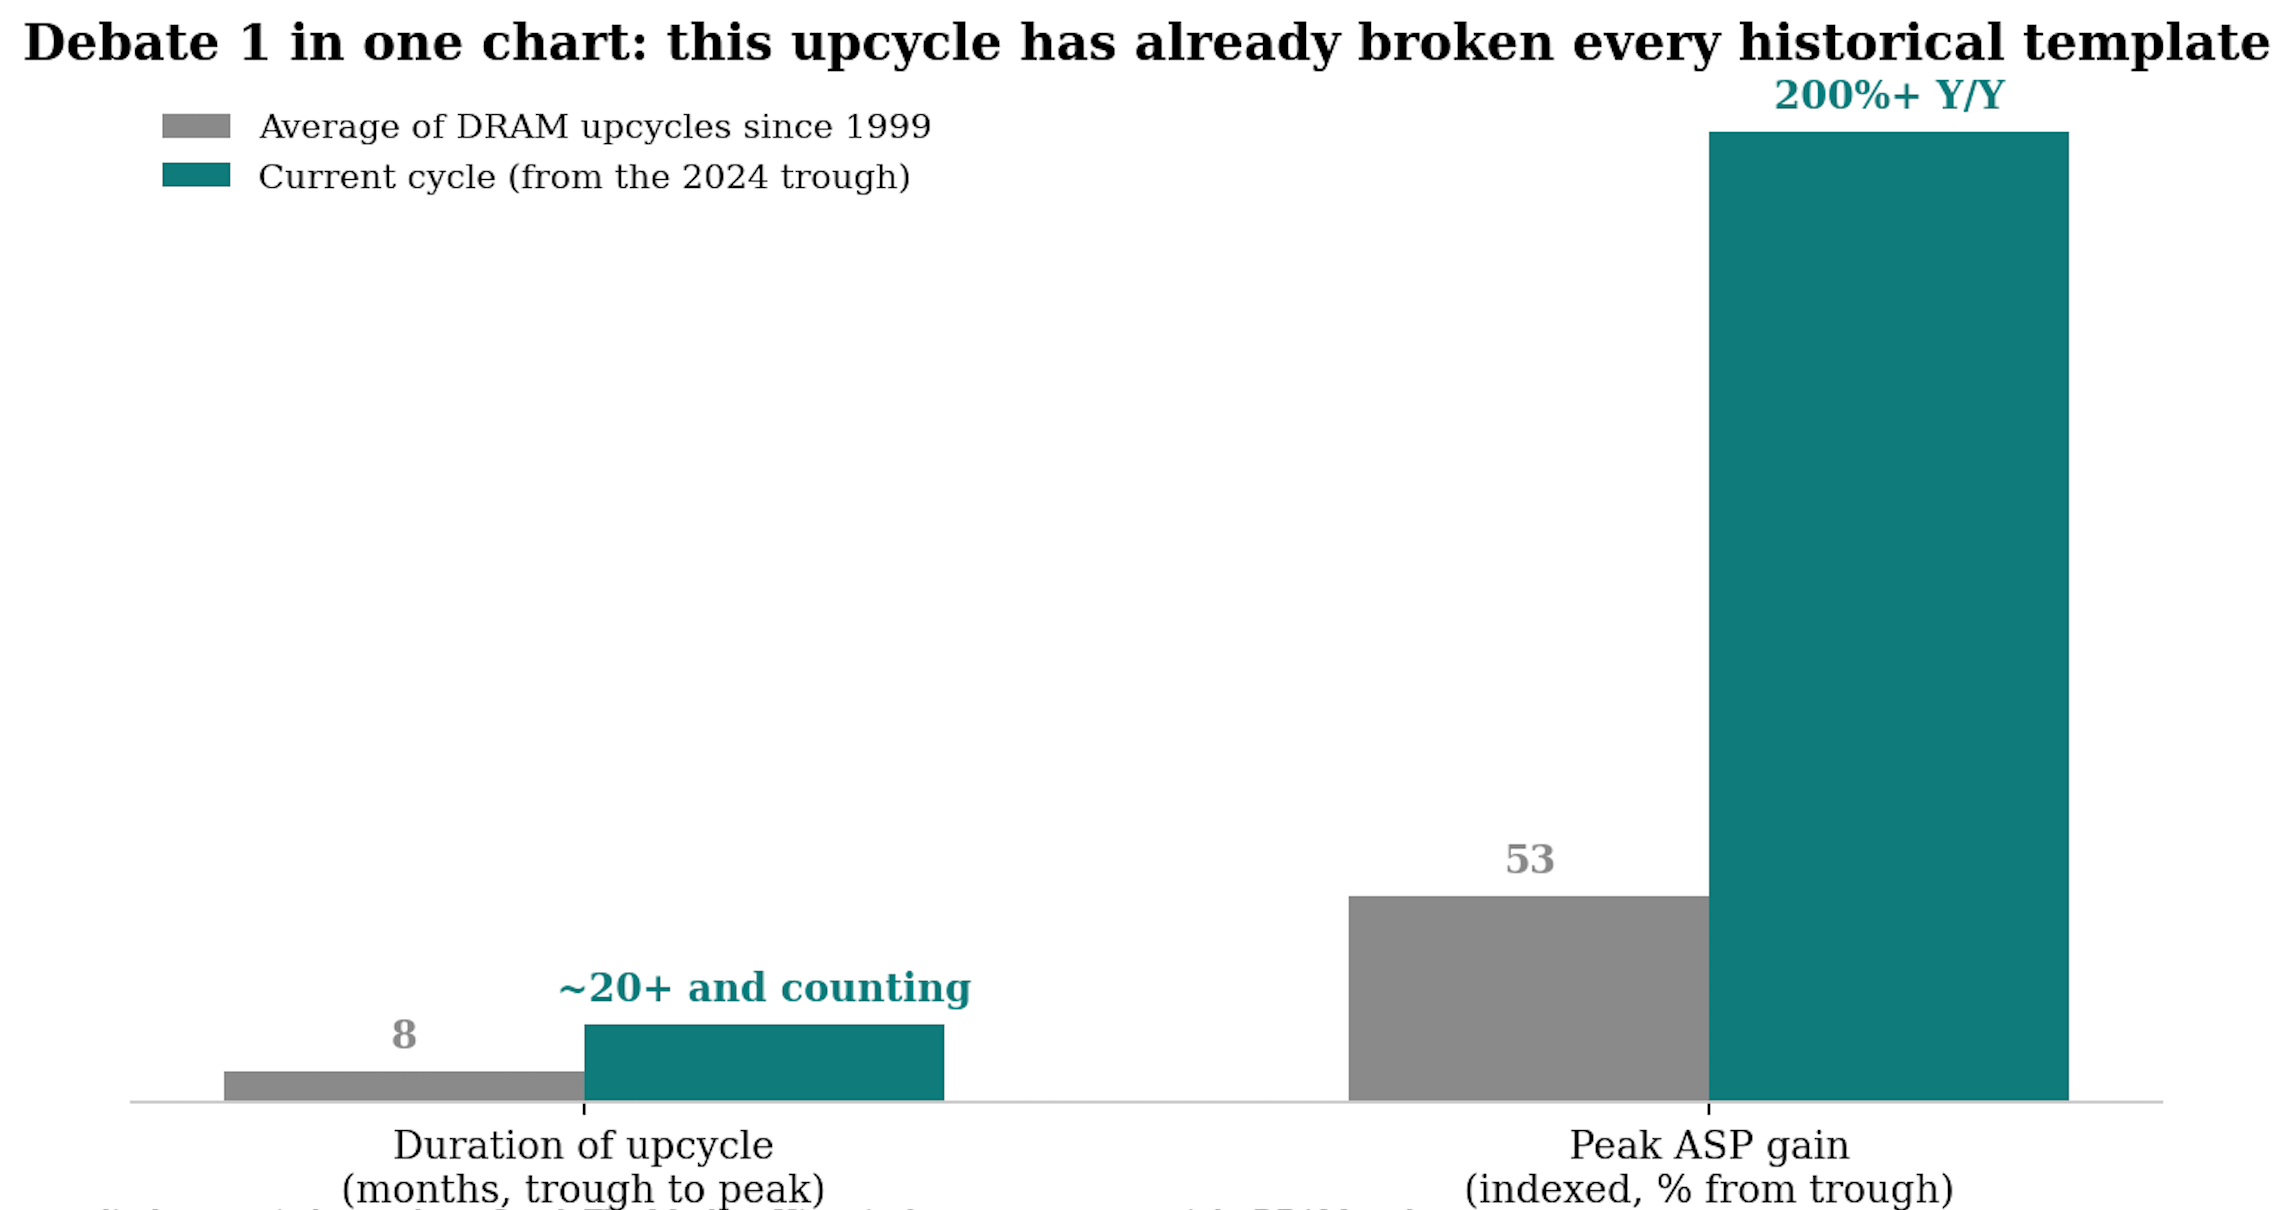
Debate 1: Supercycle, or the most seductive peak-margin trap ever set?
The bear:
Micron is guiding to an 86% gross margin. In forty years of history, the correct response to peak memory margins has always been to sell, because peak margins are the mechanism that ends the cycle: they incentivise the capacity that floods the market.
Every prior upcycle averaged about height months and modest price gains, every downturn averaged sixteen months and a 52% price decline.
The headlines at every prior peak insisted that memory had changed, the ROIC chart says it never did.
Buying a commodity at 86% margins and 13x trailing book is how memory investors have been buried for four decades.
The bull:
Every prior cycle was a demand shock hitting an industry whose cost curve deflated 30% a year and whose customers were price-sensitive consumers. This cycle is five demand engines hitting an industry whose cost curve deflates 10% a year, whose wafer capacity has not grown since 2022, whose leading product carries a 3x silicon intensity, and whose marginal customer is availability-constrained rather than price-constrained.
The supply response is not absent, it is simply slow and, netted for retirements, single-digit.
Margins are extreme because scarcity is extreme, and scarcity is measurable through 2027 at least.
My view: Both are right about their own halves. The bear is right that these margins are cyclical in amplitude: 86% is not a steady state, and anyone underwriting it into perpetuity is making the classic peak-cycle error. The bull is right that the floor has moved: the slowing cost curve, the trade ratio and the contract regime mean the next trough sits far above the last one. The correct mental model is a cycle around a structurally rising trend, not the abolition of the cycle. Practically: own the theme, but underwrite mid-cycle economics, not Q4 26 economics, and treat every quarter that prices peak margins as permanent as a chance to trim the highest-beta leg.
Debate 2: Do the LTAs hold?
The bear:
2017 already answered this: forward commitments held exactly until they were tested, then were renegotiated back to spot within quarters. Contracts between a concentrated seller and a concentrated buyer are re-cut whenever the balance of desperation flips, and no take-or-pay clause survives a customer that no longer needs the bits.
The floors are untested, the fine print is invisible (structure 3, the most popular, is also the least disclosed), and the prepayments cover a fraction of contract value.
Basically, these LTAs are barely worth more than the paper they were printed on, and only reflect the current power imbalance.
The bull:
The 2017 commitments had no prepayments, no penalties and no guarantees, today’s are engineered against precisely that failure, and the correct precedent is hard drives after 2011, where the agreements held, the industry structure stayed disciplined, and profitability became durable enough that the market re-rated the whole group.
Half of Kioxia’s bits, a third of the industry’s and rising, sixteen agreements at Micron alone: coverage is compounding, and every quarter of adoption makes the make-to-order model harder to unwind.
My view: I read the LTAs the way I read them in the Micron piece, as call options on the cycle rather than insurance against it. On the way up they are unambiguously bullish, because they extend the duration of the upcycle: they give makers the visibility to run capacity flat out, they pull prepayment capital forward, and they keep reported pricing rising long after spot has cooled, since contract resets lag the market. That duration extension is worth real money and the market is right to pay something for it. What I refuse to pay for is the claim that they dampen the downcycle, because I suspect the opposite. Floors will be renegotiated by the same customers who demanded them, deferred volume commitments will bunch supply into a falling market, and the lag that flattered revenue on the way up will delay the price signal on the way down, so that when the adjustment comes it arrives later and sharper rather than earlier and smoother (this is what was seen in analog semis post covid for example). The drives are the partial rebuttal, having held coverage through a mild 2023, but no memory LTA has met a genuine demand shock. So the dial to watch is unchanged, quarterly coverage and floor-renewal disclosure, but my prior is asymmetric: coverage holding in a downturn would be new information worth a re-rating, coverage bending would merely confirm what four decades of memory history already taught.
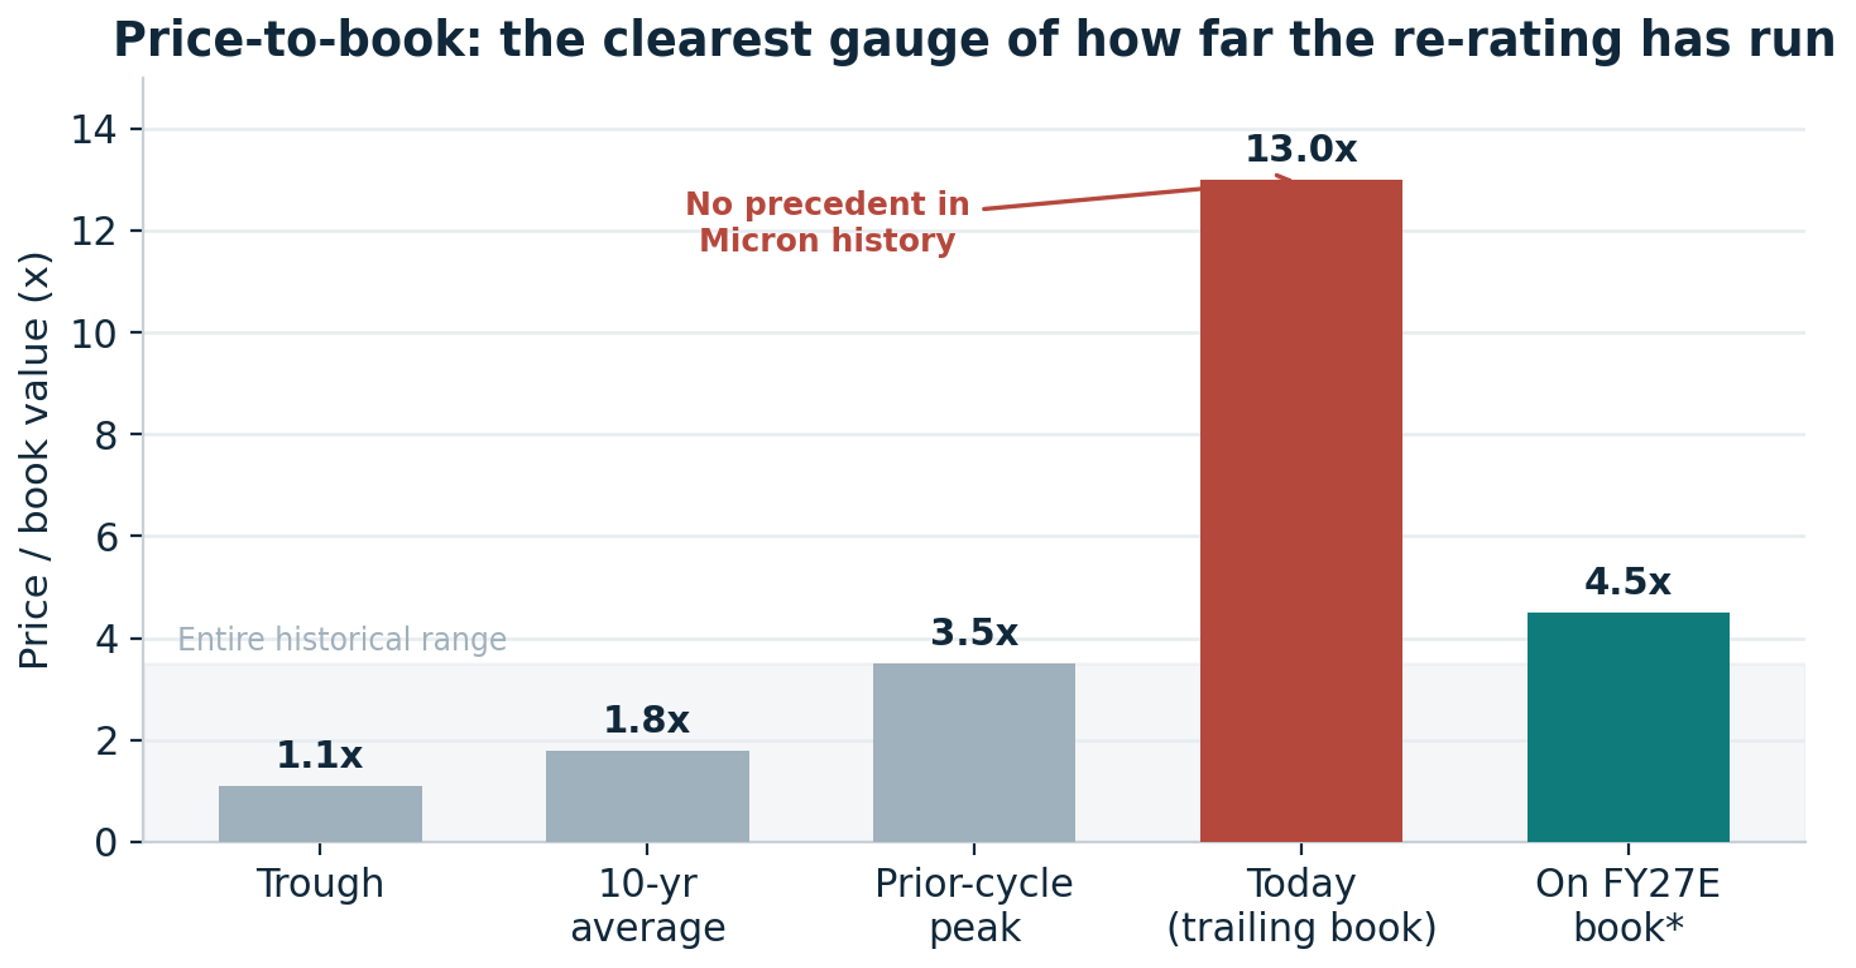
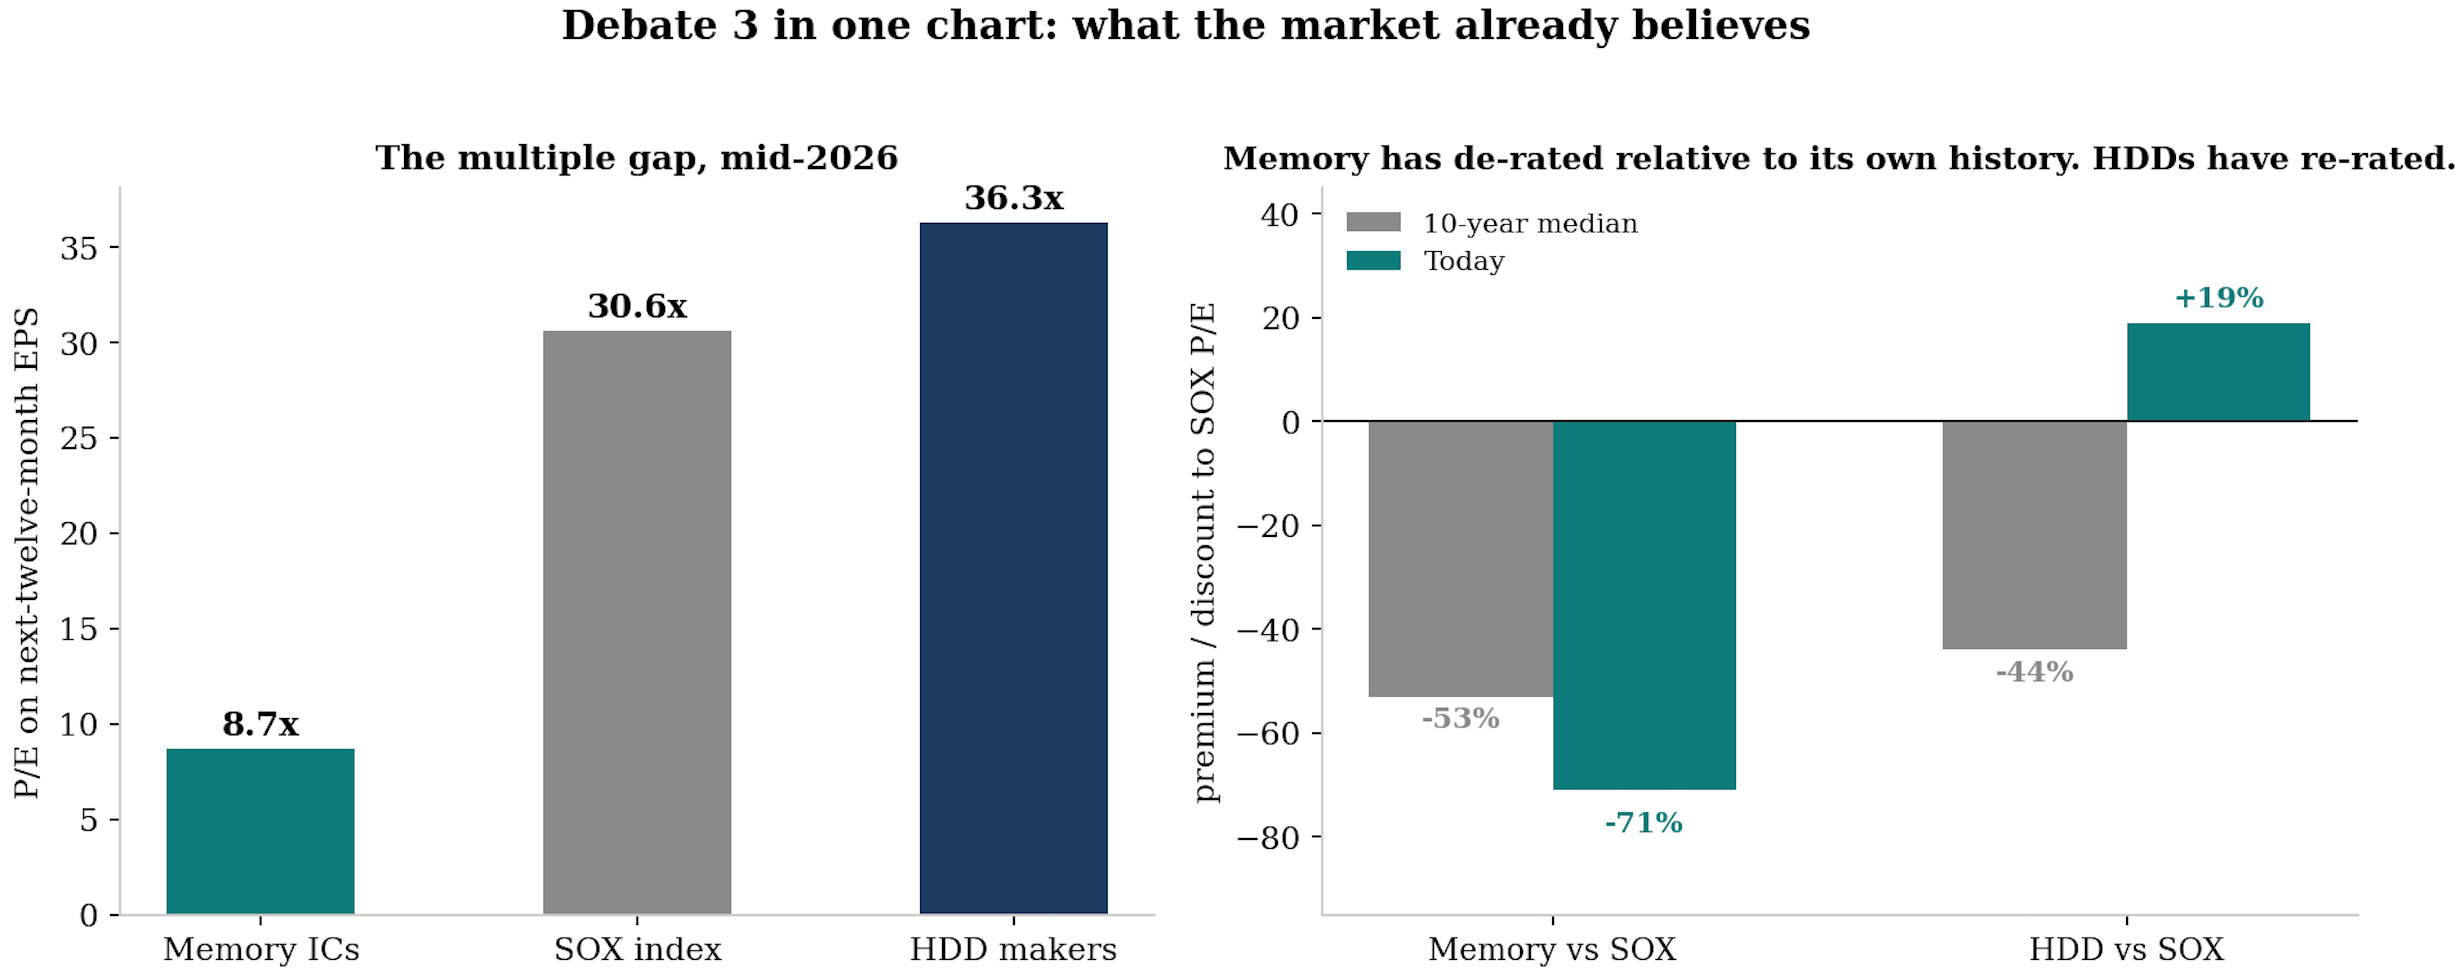
Debate 3: Does memory earn the P/E multiple?
The bear:
Micron trades near 13x trailing book against a long-run average of 1.8x, a multiple more than seven times its own history, on margins at all-time highs.
Valuing peak earnings on a P/E is the oldest value trap in cyclicals: the 6x “cheap” multiple at every prior peak preceded drawdowns of 56% on average and up to 80% in the bad ones.
Book value is the honest anchor for a commodity, and on book, this is the most expensive memory has ever been.
The bull:
The same stock trades at roughly 9x calendar 2027 earnings, a steep discount to the semiconductor index, to the foundry it increasingly resembles, and to the hard drive vendors that already made this transition.
The P/B extreme and the P/E discount are the same fact seen from two eras: trailing book reflects the commodity past, forward earnings reflect the contracted future, and if even half the LTA coverage survives a downturn, the earnings base deserves an earnings multiple. The foundry made exactly this valuation journey a decade ago.
The paradox in one chart: extreme on trailing book, compressing to 4.5x on forward book, and single-digit on forward earnings.
My view: The re-rate is earned, not granted, and the criteria are demanding: cyclicality must durably diminish, through-cycle margins must be demonstrated (not asserted), the mix must keep tilting toward contracted HBM and data-center revenue, capital discipline must survive prosperity, and differentiation must deepen through custom HBM. That is a long list that all has to go right, and current prices already pay for a good part of it. My resolution: the makers deserve a hybrid framework today, book value on the commodity tail, earnings on the contracted core, migrating toward earnings as coverage is proven through a downturn. Which is a precise way of saying the re-rate is real, partial, and path-dependent, and that the cheapest claim on it is often the arms dealers, who get paid either way.
Debate 4: Is the capex response the beginning of the end?
The bear:
It always is. P5 resumes, Yongin’s first cleanroom opens in Q1 2027, M15X is ramping now, a $24bn NAND greenfield breaks ground, national programmes promise W800tn, and industry capex is up more than 30% in 2026 with the HBM leader up 55%.
This is the top of every prior cycle described in the present tense: record margins funding record capacity that lands, as it always does, after demand has cooled. 2028, when the greenfields produce, is when the music stops.
The bull:
Run the arithmetic instead of the pattern-match. Gross Korean capacity roughly doubling by 2030 is 15% a year, net of retirements it is single digits, the trade ratio eats a third of it, and bit demand compounds in the mid-20s.
The announcements confirm the scarcity rather than cure it: the national cluster’s shells alone take three to four years and meaningful output is an eight-to-ten-year story, and the market’s own reaction is the tell, with memory stocks rising on greenfield news because supply certainty is currently worth more than supply risk.
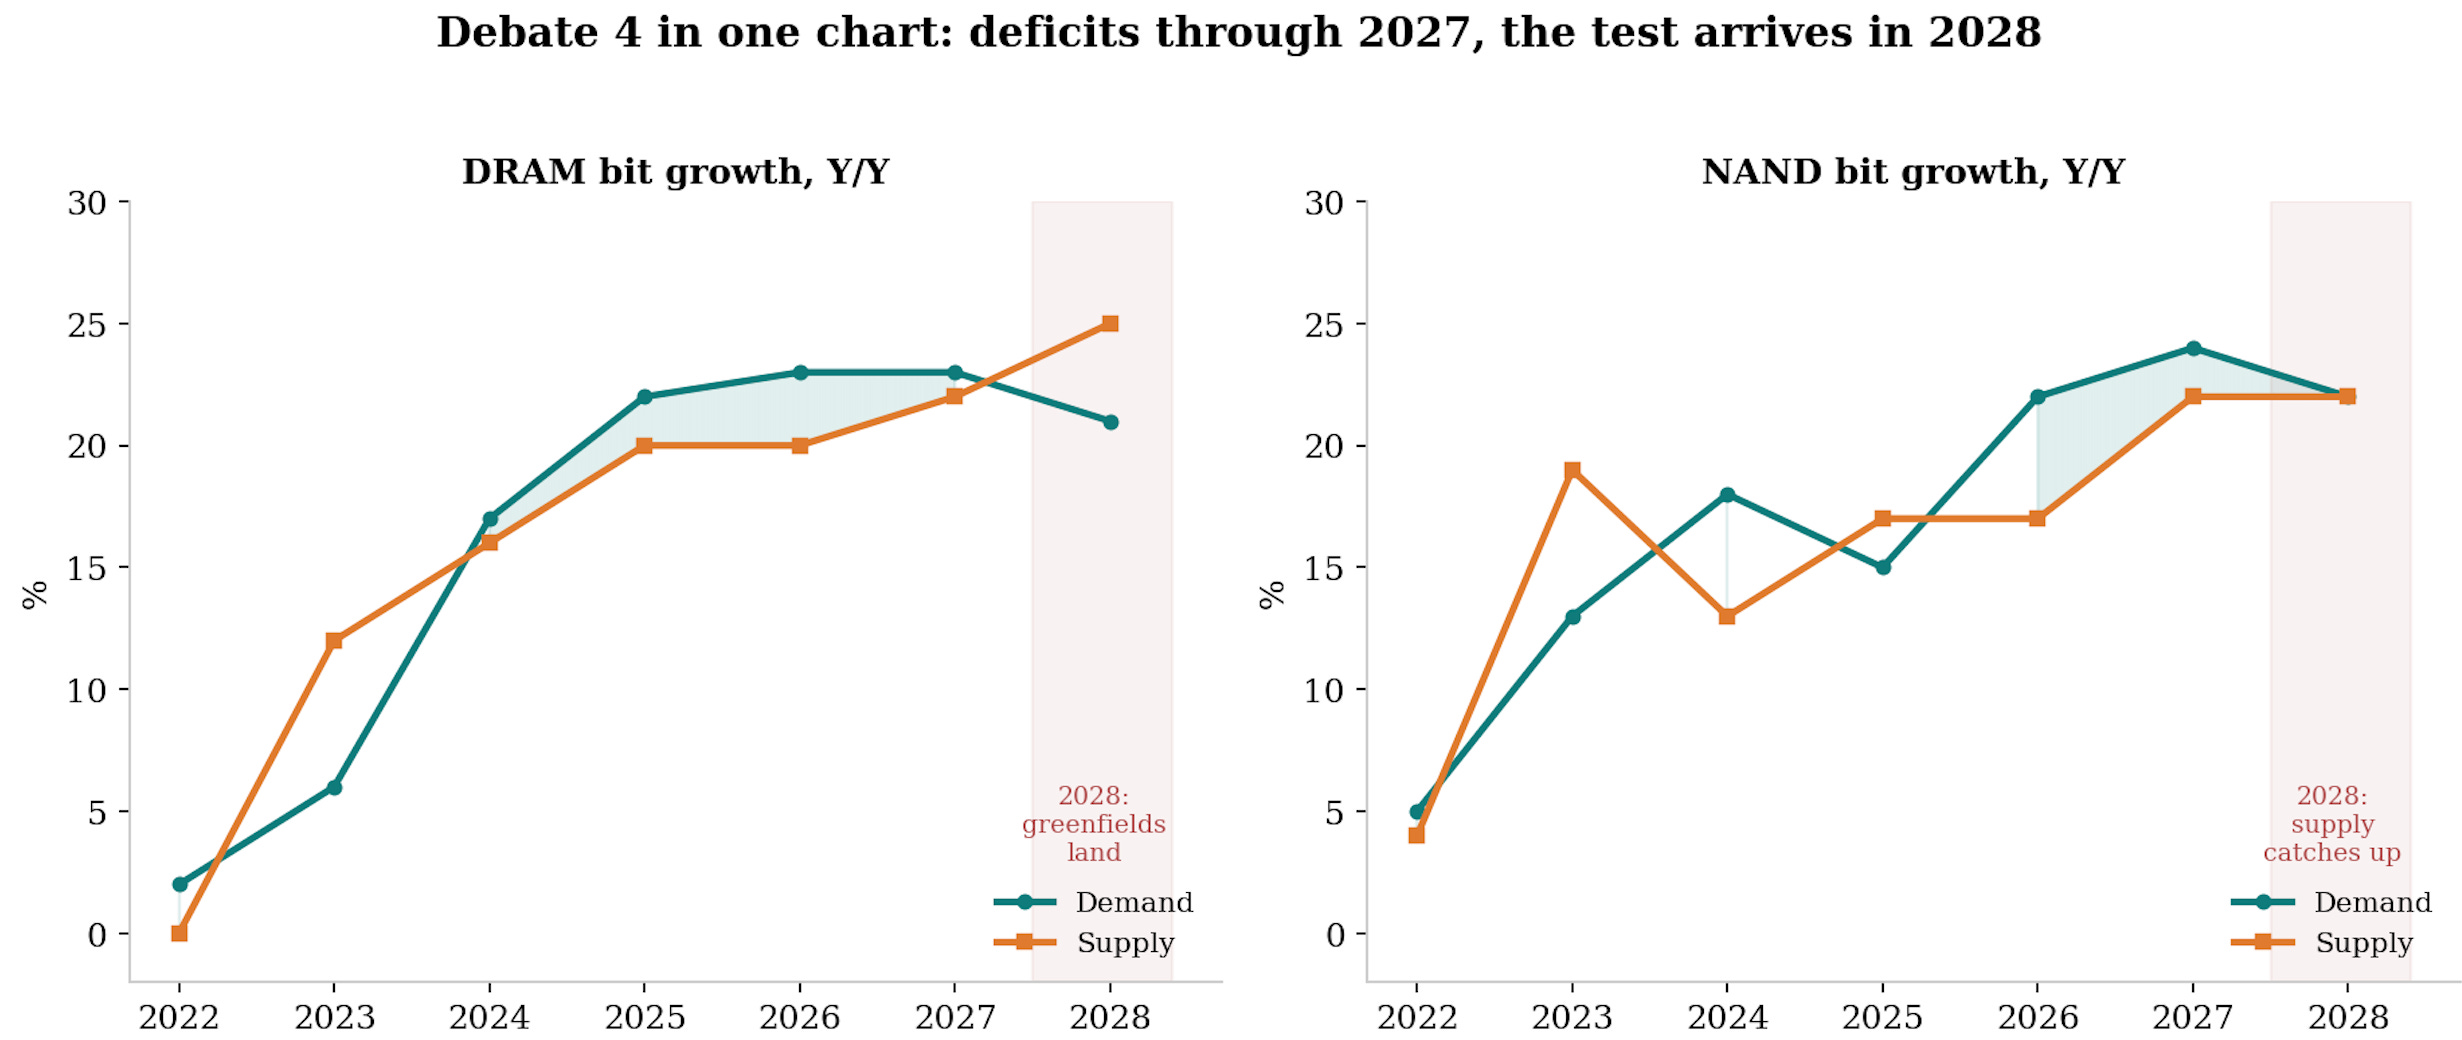
My view: This is the debate where I flip the conventional read most strongly. In every prior cycle, capex announcements were the sell signal because they added supply to a demand line that was flat to cyclical. Here the announcements are better read as confirmation of a demand regime that the makers, who see the order books, believe extends past 2030, nobody commits W800tn against a two-year squeeze. But the inversion has an expiry date: from 2028 the greenfields produce into whatever world exists, and if the demand engines have stalled by then, the old physics reasserts itself with the old violence. So the honest position is time-boxed: supply cannot spoil this market before 2028 almost regardless of behaviour, after 2028 it absolutely can, and the 2027 capex decisions, made at peak margins, are where the discipline thesis gets its real test.
Debate 5: Does efficiency eat the demand?
The bear:
The shortage is calibrated to today’s technology stack, and the brightest minds in hardware and software are working, right now, on reducing dependence on the memory makers, because a 30-48% memory tax makes that the highest-ROI engineering project on earth.
Software ships in weeks: KV-cache compression, eviction and paged attention attack the quadratic scaling, quantisation to FP8 and FP4, distillation and mixture-of-experts designs shrink the bits that must sit in expensive memory, the fact-versus-reasoning split offloads static knowledge to cheap DDR and reserves HBM for genuine reasoning.
Hardware follows: memory pooling and disaggregation over CXL raise utilisation and strand fewer idle bits, high-bandwidth flash and fast SLC tiers absorb workloads from pricey DRAM, processing-in-memory and larger on-die SRAM trim external HBM per accelerator.
Change the stack, change the demand curve.
The bull:
Every one of those efficiencies has existed as a research direction for years, and demand estimates have risen through all of them, because efficiency in computing does not reduce consumption, it expands it.
Cheaper inference means more inference, every halving of memory per query has been met with context windows growing 30x a year and agents that multiply queries.
This is the oldest rebound effect in technology (the famous Jevons paradox), and betting against it has been wrong for seventy years.
My view: The rebound argument wins on a multi-year horizon, but the bear case deserves more respect than the bulls give it on a one-to-two-year horizon, because the buyers are not neutral optimisers, they are hostile ones and the rate of price increases of memory is now unsustainable: the memory tax has given the largest customers in the world a direct financial incentive to fund and deploy every efficiency lever at once, and software levers land inside a fiscal year. The scenario that hurts is not demand disappearing, it is one visible quarter in which hyperscaler memory content per system flattens while capacity ramps, because the market would reprice the whole complex on the derivative long before the level turned. Watch content-per-accelerator disclosures and the KV-cache software literature as leading indicators, they are freely available and almost nobody in equities reads them.
Debate 6: The China question
The bear:
The threat to an oligopoly is never the incumbents, who have every incentive to behave, it is the fourth force that does not play by oligopoly rules. CXMT is scaling from roughly 6% of DRAM bits toward double digits, YMTC from 12% of NAND toward the mid-teens, both with state capital that does not require returns, and volume share is exactly what breaks a commodity’s pricing: you do not need the best product, only enough adequate product.
Worse, the incentive structure invites a sponsor (as we have seen very recently with Apple petitioning to get access to Chinese memory): a consumer-exposed mega-buyer facing 100% memory cost inflation has every reason to qualify, nurture and fund a non-incumbent source, in China or, perhaps more plausibly, in Japan, financing the very capacity that drags prices back down.
The bull:
China’s entrants are locked out of the leading edge (and the hyperscaler market) where the value pool now sits: HBM requires advanced nodes, EUV access, TSV and stacking yield that take a decade to build, and export controls hold the door shut.
Their share gains are concentrated in the commodity tail the incumbents are actively abandoning, which arguably accelerates the incumbents’ mix shift rather than undermining it.
And their expansion is itself constrained by the same tool lead times as everyone else’s.
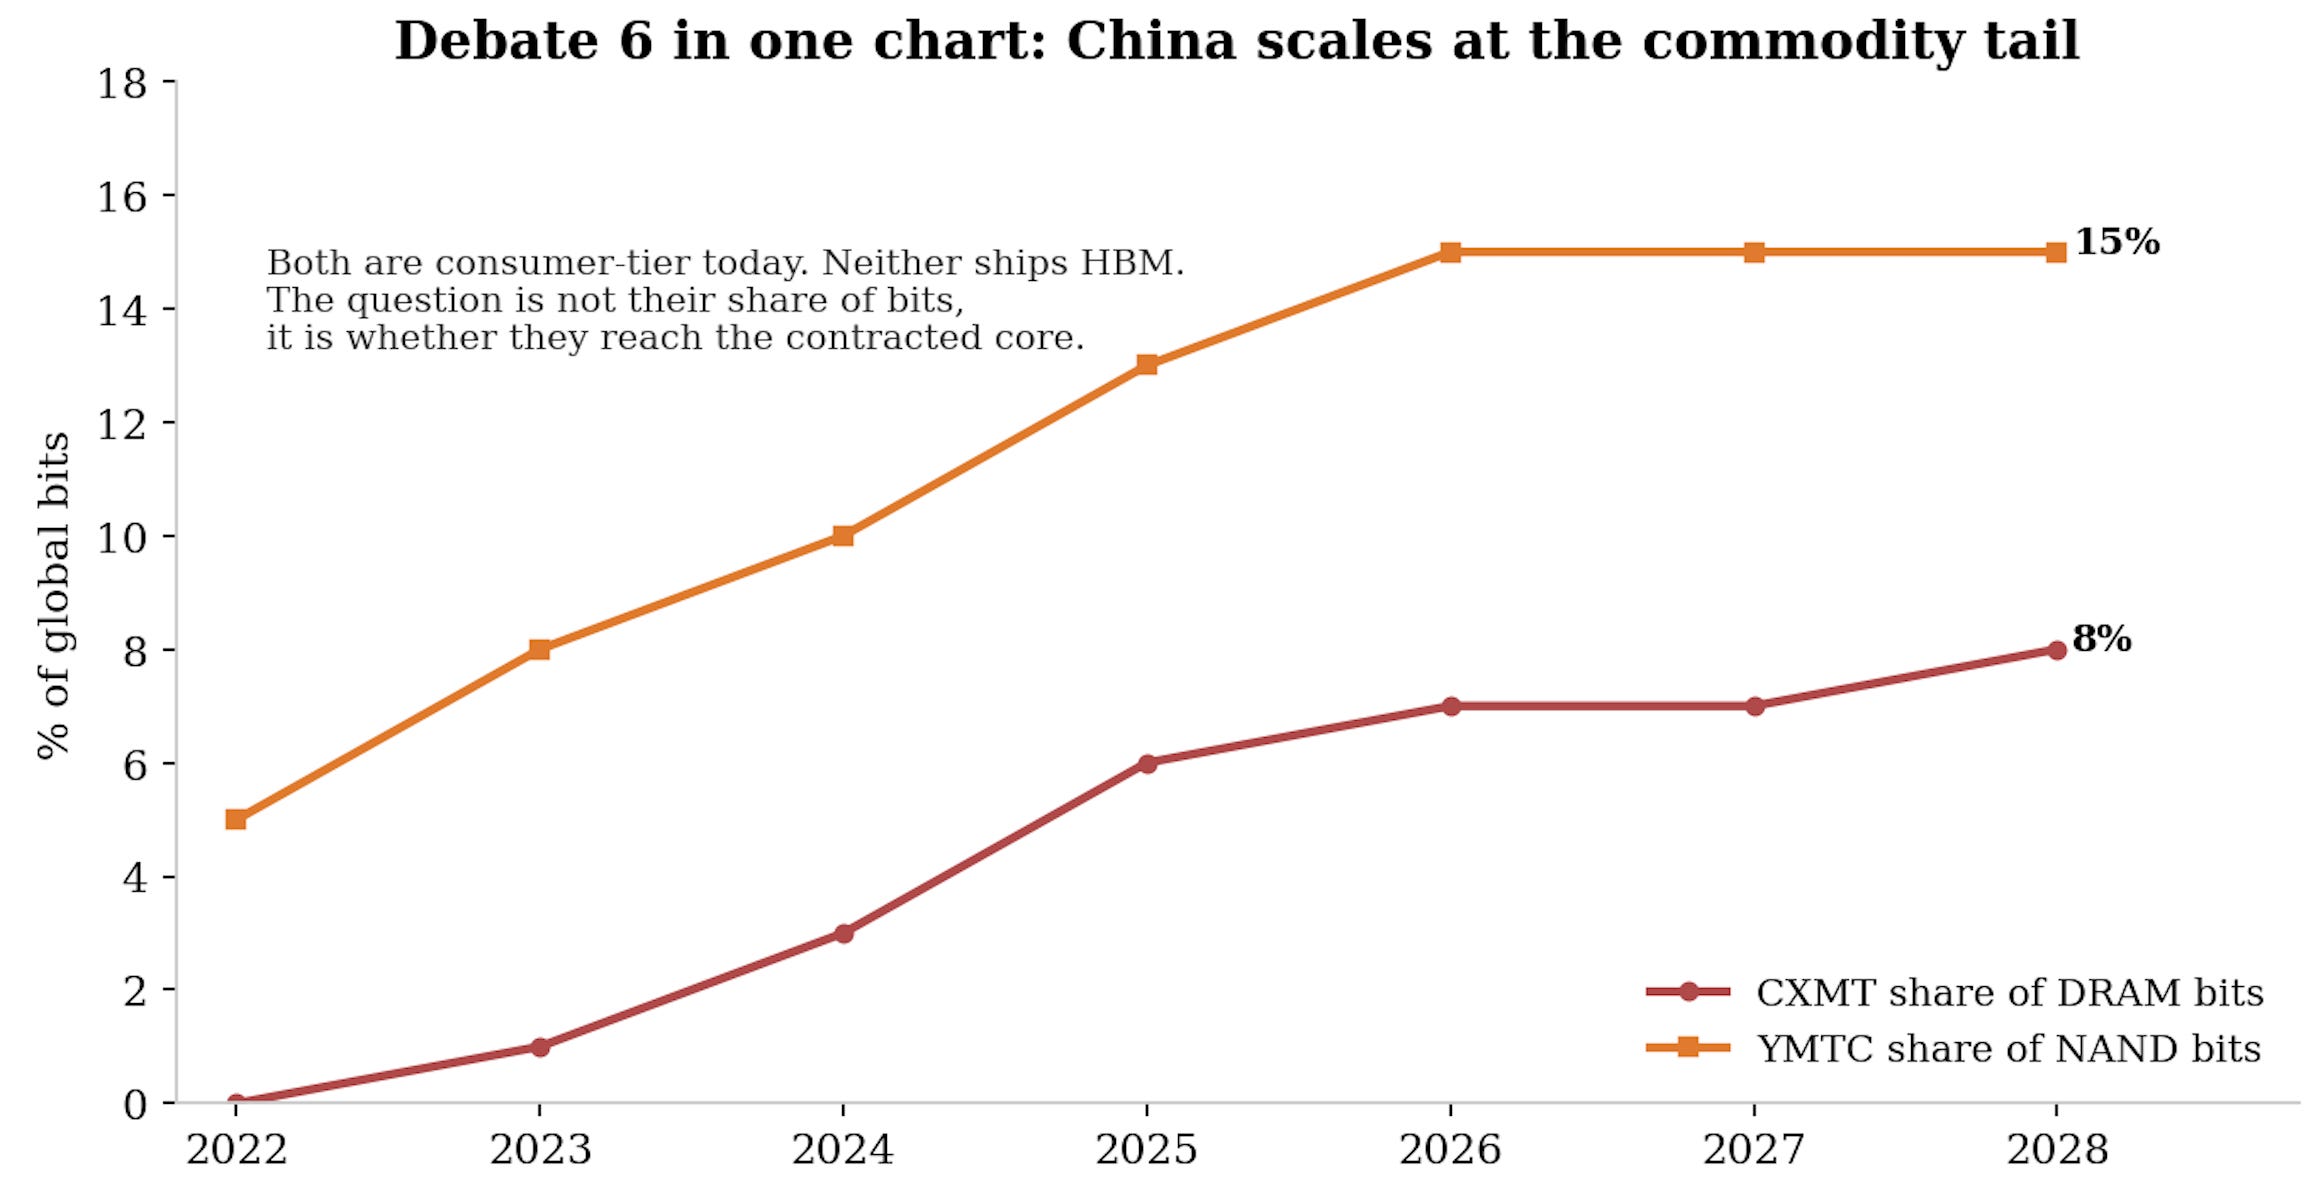
My view: Both true, in different markets. China cannot touch the HBM and contracted data-center pool this decade, which protects the de-commoditisation thesis where it matters most, China absolutely can and will cap the upside and deepen the downside of the commodity tail, which is precisely the part of the business the trailing P/B still capitalises. The practical conclusions: prefer exposure weighted toward the leading edge and the contracted book, treat the commodity tail as structurally lower-multiple, and watch the sponsor scenario, because the day a Western mega-buyer visibly funds alternative capacity is the day the discipline premium starts to leak. The full treatment, CXMT, YMTC, the equipment localisation race and the sponsor game theory, is the dedicated China piece later in this series.
Debate 7: Can the AI economy pay for its memory?
The bear:
Memory is heading toward half of hyperscaler capex, hyperscaler capex is heading toward $1tn, and the AI revenue standing beneath that pyramid remains a fraction of the infrastructure spend.
Somebody is being crowded out already: consumer devices face memory cost inflation approaching 100%, handset makers are cutting volume plans by double digits, and entry-level electronics face the ugliest math.
If AI monetisation stalls, the rationale for the LTAs, the capex and the whole shortage weakens fast, memory is a leveraged bet on AI capex, and you cannot believe in the memory without believing in the capex.
The bull:
The capex is contracted, financed and power-constrained years forward, inference demand now scales with usage and revenue rather than with experimentation, and the memory tax is self-limiting in the healthiest possible way, because it forces workloads toward the tiers that monetise.
Even the cautious scenarios hold infrastructure spend at levels that keep memory in deficit through 2027.
My view: This is the master question of the entire AI trade, and I refuse to pretend memory is insulated from it: memory is the most operationally levered claim on AI capex that exists, which is exactly why it has outperformed on the way up and why it will not decouple on the way down. My framework, laid out in the AI Supercycle and Inside the Room pieces (in which I say that the companies building the AI economy and the veteran analysts are both saying that the supercycle will continue but that we are also in a bubble that will burst), is that a speculative capital structure has been bolted onto a real industrial transformation, the demand is real and supply-constrained, the funding is partly reflexive. The reconciliation is exposure design rather than side-picking: own the theme through the instruments that survive the reconciliation (the arms dealers with their service floors, the contract-protected storage duopoly, the makers sized for their beta), keep dry powder for the drawdowns this structure guarantees, and never confuse a supply-constrained industry with an invulnerable one. I will address this AI monetisation question in a standalone piece given this sits at the very center of the entire AI supercycle.
So: should you own memory right now?
Yes, with structure.
The honest synthesis of the seven debates is that the singularity is real but partial: the leading-edge, contracted core of this industry has genuinely stopped being a commodity, while a commodity tail remains attached to it, and the market is being asked to price both at once at peak margins.
That argues for:
Owning the theme through the cycle rather than trading the quarter.
Preferring the expressions whose earnings survive the bear cases (equipment, test, the drive duopoly, the contracted core of the makers).
Sizing the pure makers as the high-beta satellite they are.
Treating the inevitable drawdowns, and this complex delivers 30 to 50% drawdowns even inside secular uptrends, as the entry points the structure guarantees.
What would change my mind: contract coverage failing its first downturn test, a visible flattening of memory content per system, or a sponsored fourth source at the leading edge. None is present today.
8. The playbook and the dashboard
The framework, ahead of the stock-by-stock selection piece:
Core: the arms dealers. Equipment and test content per bit rises in every scenario that does not involve the end of the build-out, services and consumables put a floor under the downside. This is where risk-adjusted returns live in my view.
Satellite: the makers. The highest torque on the thesis being right, sized for 30 to 50% drawdowns, added to on capex-scare and macro drawdowns rather than chased on record prints, underwritten on mid-cycle economics.
Ballast: the contracted storage layer. The drive duopoly and the most contract-covered NAND exposure offer the best proven downside protection in the theme.
Discipline: the 2028 clock. Supply cannot spoil this market before 2028, it can after. But the market could decide to already price this reversal, especially if sequential pricing cools. Position sizes should reflect that asymmetry now and be revisited as the greenfield wave approaches production.
And the dashboard I actually run, one line per signal:
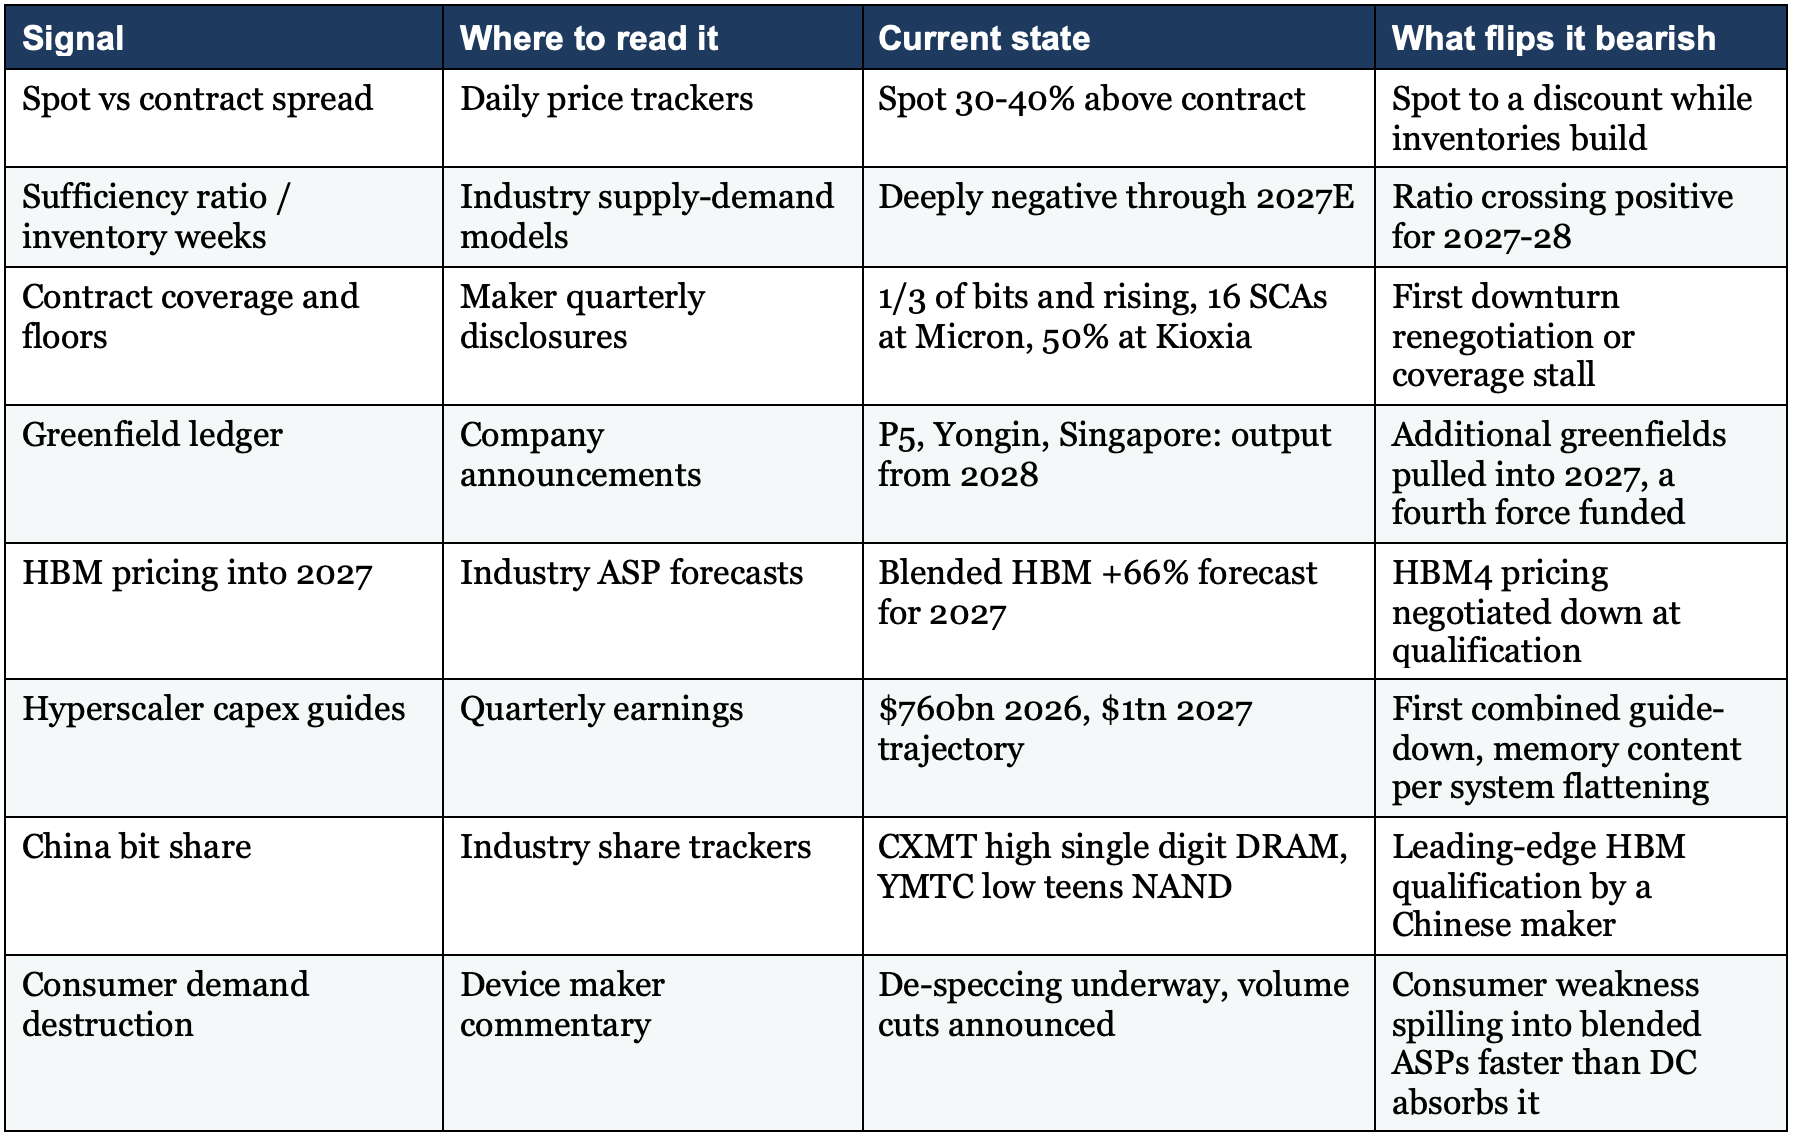
9. Conclusion
Memory spent forty years as the most brutal commodity in technology: a business that destroyed capital with metronomic reliability, where the correct response to prosperity was fear.
That history is why the current moment reads as impossible: gross margins approaching software levels, $50bn revenue quarters, contracts stretching to 2029, a national programme measured in the hundreds of trillions of won, and a $3.9tn market cap complex that was worth $420bn eighteen months ago.
The primer’s answer is that the impossible has a mechanism.
Demand broadened from one engine to five and its marginal buyer stopped being price-sensitive.
Supply lost its deflation engine to physics, its spare capacity to the trade ratio, and its speed to tool lead times.
And the pricing architecture itself is being rebuilt from spot discovery toward negotiated, floor-protected, prepaid commitment.
None of this abolishes the cycle, all of it raises the axis the cycle turns around.
The commodity has not merely become expensive. Part of it has stopped being a commodity at all, and the market is still learning how to price a thing that changed category.
The cycle is not dead. It has been given a floor, a contract, and a customer who cannot walk away. That is what a singularity looks like from the inside.
The Memory Series will continue.
I started with a deep dive on Micron post its record breaking Q3 2026 results.
This is the memory singularity primer, the most comprehensive guide to the first trillion-dollar memory market.
Next will cover the winners and losers of this memory singularity, ranking every expression across makers, equipment, test and storage, then the dedicated China piece (CXMT, YMTC and the sponsor game), then the individual names, SK Hynix, Samsung, and the storage and equipment champions.
Subscribe and join Crack The Market to follow the rest of the Memory Series.
In Part 2, I deliver the Winners and Losers playbook. I start where this primer’s framework points, with the arms dealers, ranking the equipment, bonding and test names on memory exposure, complexity growth and downside protection. I work through the makers, sizing the DRAM oligopoly against the NAND clusters and scoring each on contracted coverage, HBM position and balance sheet strength, and I finish with the storage layer, the drive duopoly and the most contract-protected NAND expressions. Every name gets a verdict, and paid subscribers vote on which one receives the next dedicated deep dive.
Part 3 then takes on the question that shadows every debate in this piece: China. The real trajectories of CXMT and YMTC, the equipment localisation race behind them, and the sponsor game theory, because the day a Western mega-buyer visibly funds a fourth source is the day the discipline premium starts to leak. But the China risk is only intelligible once you know which companies carry it. That is what Part 2 is for.
Disclaimer: The information provided on this Substack is for general informational and educational purposes only, and should not be construed as investment advice. Nothing produced here should be considered a recommendation to buy or sell any particular security.